FORECAST CITY
Sign in
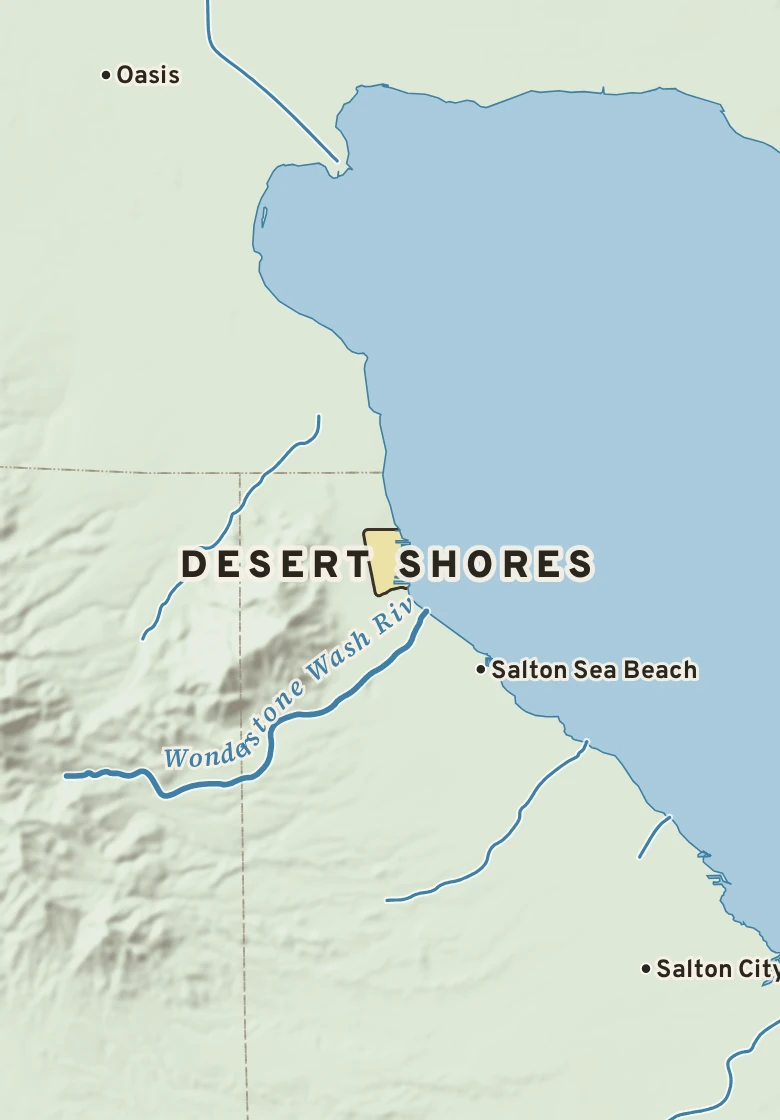
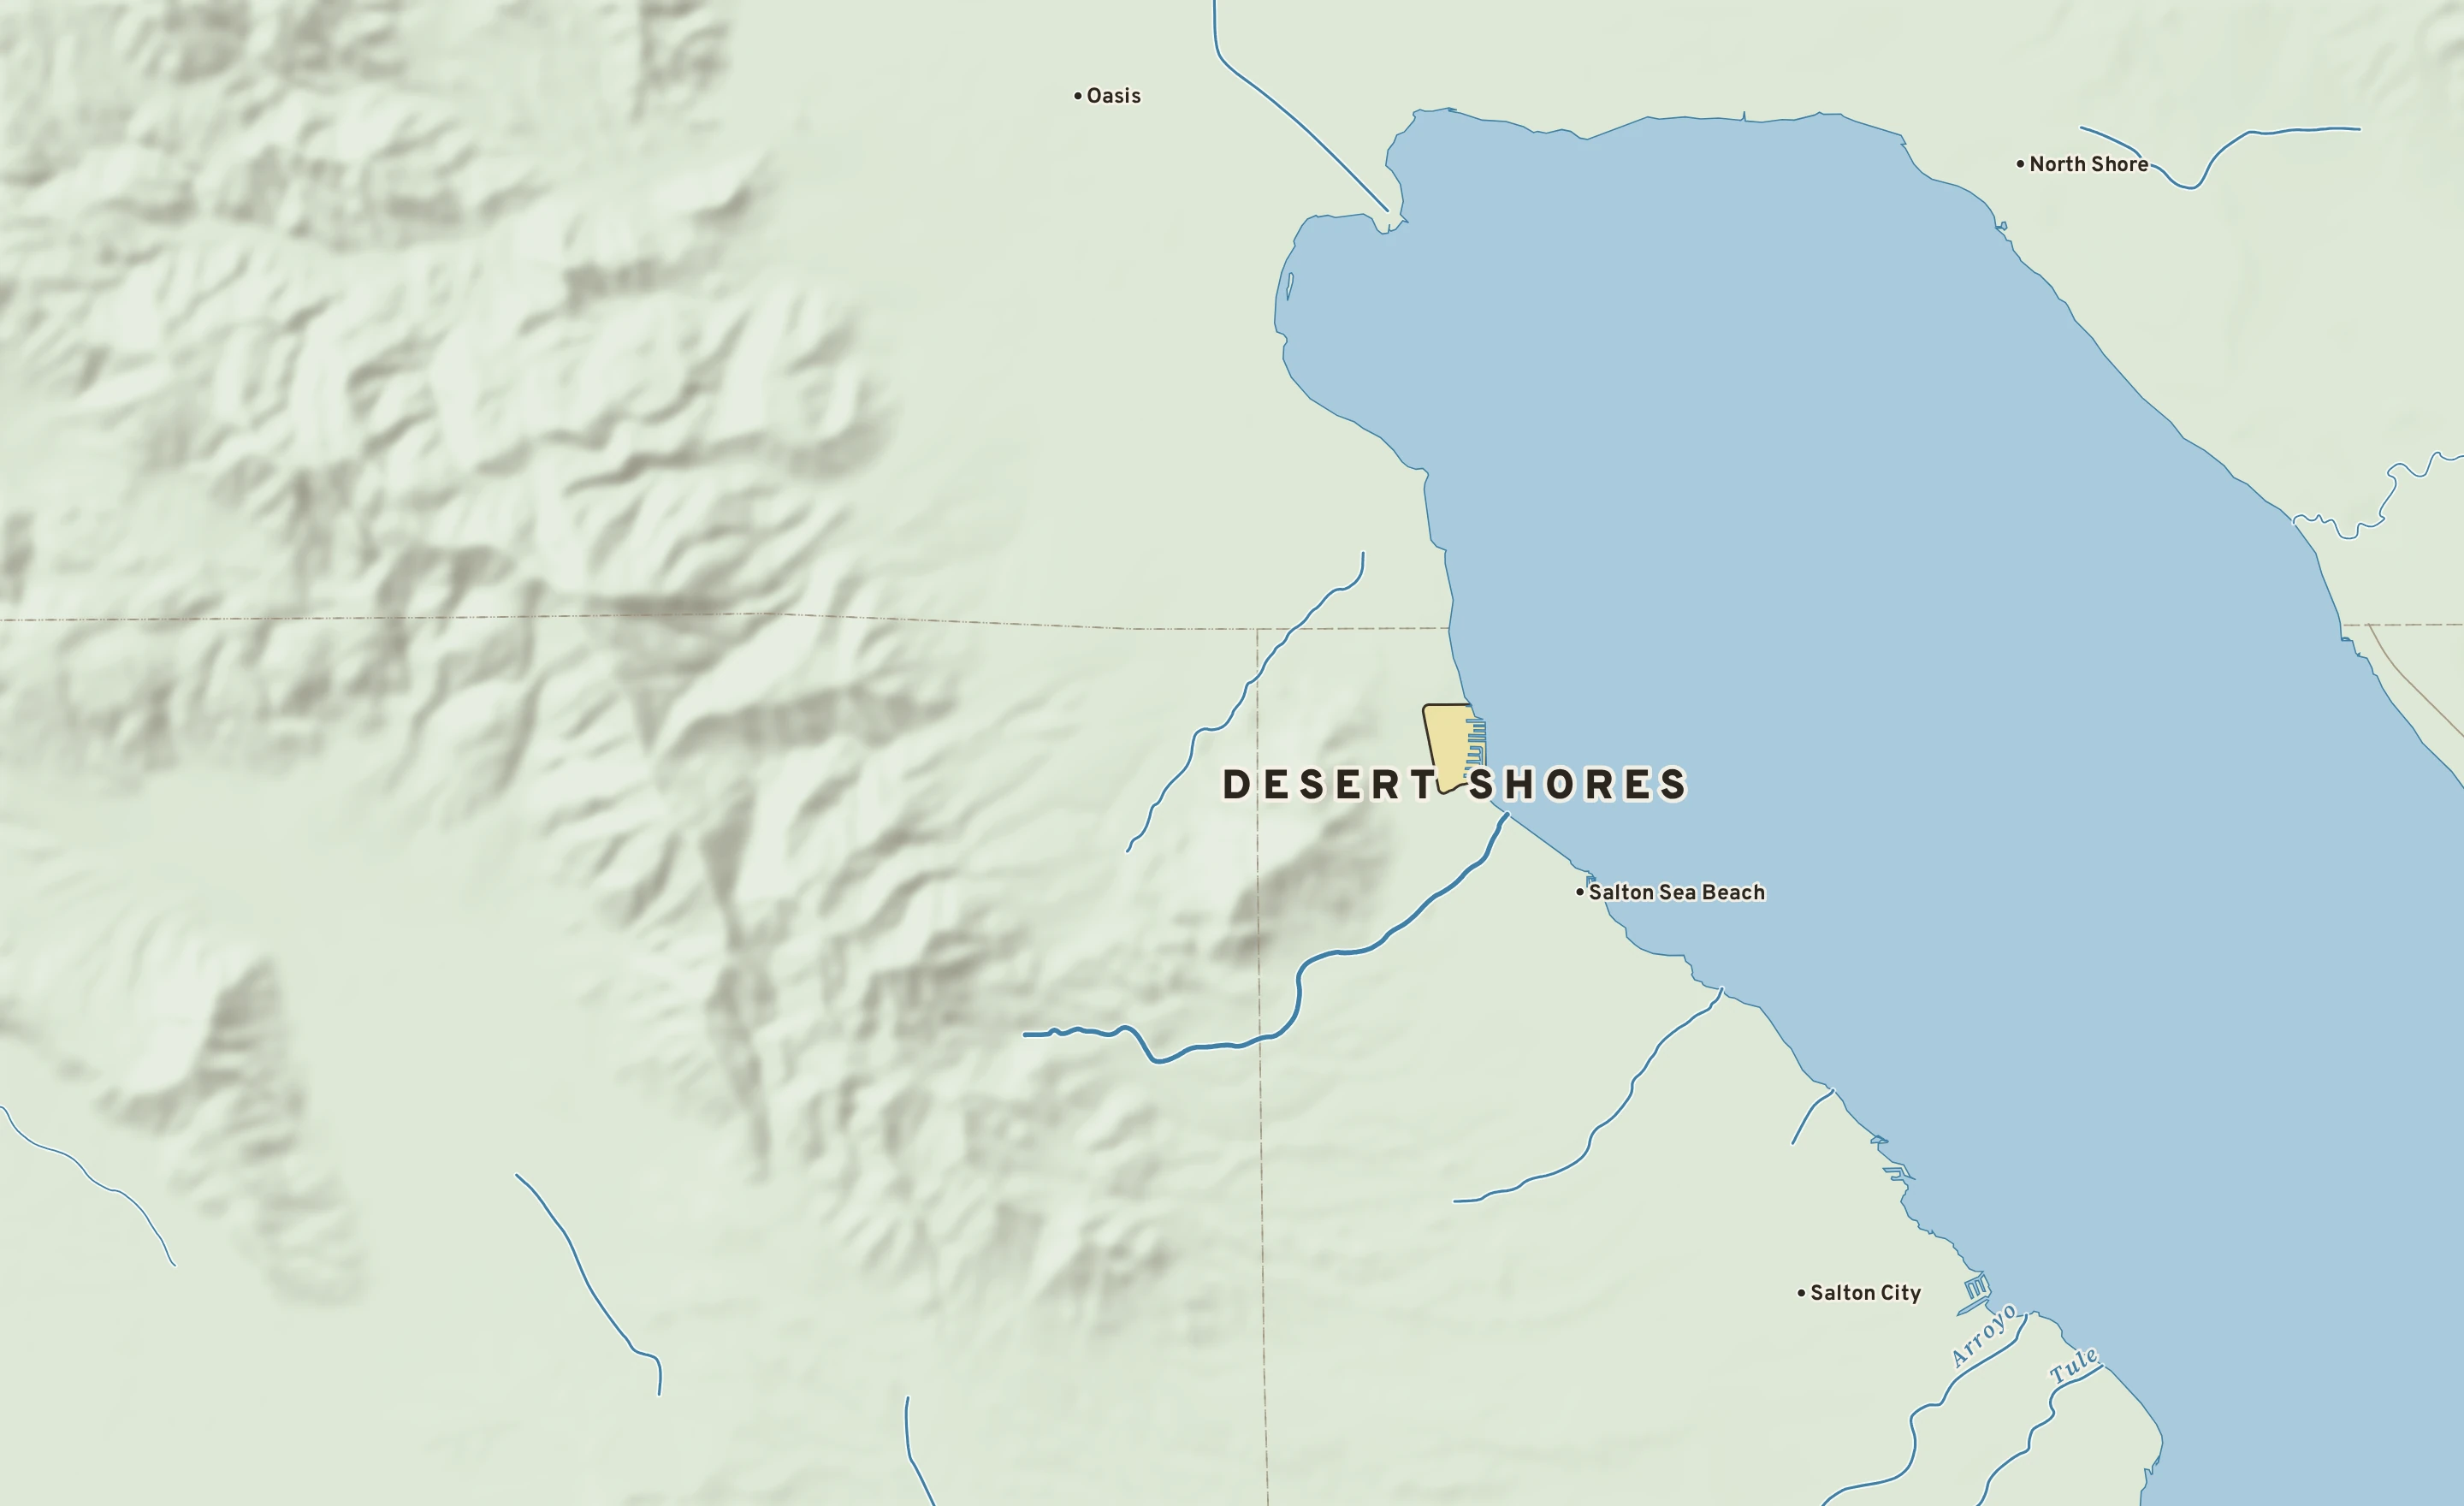
Shaded-relief map of Desert Shores, California: rivers, roads, the city limits and where the water drains.
CALIFORNIA · IMPERIAL COUNTY

Desert Shores

1,128 people, 210 ft below sea level in Imperial County.

-210 ftElevation, city center
1,128People, 2024 estimate
1 sq miLand area
Sunny 78°
Sunny now Dew point 50° · NNE 3 mph · high 78°
City of Desert Shores River Interstate 2 miles
Explore the plate Order a print

The Desert Shores plate. Relief from Copernicus GLO-30; rivers and lakes from USGS NHD; watersheds from the USGS Watershed Boundary Dataset; roads and city limits from Census TIGER 2024.

MILE1
TODAY

Today in Desert Shores

NWS forecast and National Blend of Models · updated 1:00 PM PST
RIGHT NOW Jacqueline Cochran Regional Airport (KTRM) · 1:52 PM
Sunny
78° Sunny Feels like 78° · high of 78° near 2 PM
WindNNE 3 mphno gusts
Humidity37%falling to 35% this afternoon
Pressure29.86 in →steady
Visibility10 mihaze-free
CloudsClear
UV index—no forecast
Dew point 50° · Dryabout the same for three days
DryComfortableStickyMuggyOppressive
NEXT RAIN
Partly cloudy
Thursday30% chance · showers
LIKELY AMOUNT—amounts come within 3 days
LAST RAINOct. 230.01 in · 22 dry days
ALERTS & OUTLOOKS
No watches or warnings for Imperial County
NWS Phoenix and the Storm Prediction Center · checked 2:15 PM
SUN & MOON
↑ 6:14 AM4:42 PM ↓
10 h 28 m of daylight, 2 minutes less than yesterday
Waxing crescent, 26% lit. Next full moon: Nov. 24.
AIR & POLLEN
44
GOODAir quality index · ozone
Tomorrow: 55, moderate. No pollen source yet.

The next three days, hour by hour

Sky: clear, cloudy, night Rain likely National Blend of Models
SATURDAY, NOV. 14
SUNDAY, NOV. 15
MONDAY, NOV. 16
TUESDAY, NOV. 17
2p
5p
8p
11p
2a
5a
8a
11a
2p
5p
8p
11p
2a
5a
8a
11a
2p
5p
8p
11p
2a
5a
8a
11a
clear day
clear night
clear night
clear night
clear night
clear day
mostly sunny
clear day
mostly sunny
partly cloudy night
partly cloudy night
partly cloudy night
partly cloudy night
mostly sunny
mostly sunny
mostly sunny
mostly sunny
mostly clear night
partly cloudy night
partly cloudy night
mostly clear night
mostly sunny
mostly sunny
mostly sunny
TEMPERATURE °F
78°
55°
78°
57°
78°
55°
CHANCE OF RAIN
50%
WIND, MPH
2
3
5
3
1
2
0
6
6
3
1
2
3
3
1
5
5
4
4
4
5
5
6
6
HOW IT FEELS · DEW POINT
Dry: dew points 48 to 57° ↑ The front passes Drier: 44° by Tuesday

The next seven days, and how sure we are

Forecast, with the range 8 in 10 ensemble members agree on Normal, about 79° / 45°
SAT Nov. 14 Sunny Sunny
78° 51°
0% rain — W 2 A
SUN Nov. 15 Mostly sunny Mostly sunny
79° 52°
0% rain — SE 3 A
MON Nov. 16 Mostly sunny Mostly sunny
79° 50°
0% rain — SE 3 B
TUE Nov. 17 Sunny Sunny
75° 45°
10% rain — W 6 B
WED Nov. 18 Mostly sunny Mostly sunny
73° 45°
0% rain — SE 5 B
THU Nov. 19 Partly cloudy Partly cloudy
73° 44°
30% rain — S 6 B
FRI Nov. 20 Sunny Sunny
72° 43°
10% rain — NNW 5 C
How sure are we? AModels agree: highs within 4° BSome spread: within 8° CWide spread: check back
Range from the National Blend of Models percentiles · graded on Forecast Scores
AIR MAIL

Where today’s air came from

The air arriving over Desert Shores about 5,000 feet above the ground was over the southern Rockies three days ago, and over southern California a day ago, about 580 miles back along its path. Most of the nine paths traced from around the city agree. It came down from about 9,000 feet up, warming and drying as it sank. Near the ground the air came from the Great Basin; at 10,000 feet, from the desert Southwest. Traced back 72 hours through NOAA’s hourly RAP analyses, nine paths at each of three heights.

THIS WEEK IN 1999 Nov. 12, 1999

The hottest this week has been

96° on Nov. 12, 1999, the hottest reading for this week of the year since 1950. Next is 95° in 1995.

95°
96°
19951999
Source: NOAA RCC-ACIS, the Desert Resorts Regional Airport record since 1950.
MILE2
THE GROUND

What Desert Shores stands on

Desert Shores’s center stands about 210 ft below sea level. Within three miles the land runs from -230 ft to 1,740 ft, a difference of 1,970 ft: steep hill country. The highest named summit within 15 miles is Rabbit Peak, about 6,640 ft, 12 miles west.

Under the town center the state geologic map shows Quaternary alluvium and marine deposits (coarse-detrital), from the Pleistocene to Holocene, less than 2.6 million years old.

The section below crosses 7 rock units mapped at the surface.

Desert Shores, cut in half from west to east

A section west to east, 24 miles through the town center
0 ft2,000 ft4,000 ft DESERT SHORES-210 ftHigh point of the line5,230 ft ← WE →

Heights every 0.1 mile from the Copernicus GLO-90 surface model; vertical exaggeration about 4×. The colored band under the surface is the rock the state geologic map shows at the surface, not a picture of what lies beneath.

Rock at the surface along the line

Plio-Pleistocene and Pliocene loosely consolidated deposits

Sandstone, conglomerate. Age: Miocene to Pleistocene, less than 23 million years old. About 3 mi of the line.

Older Quaternary alluvium and marine deposits

Coarse-detrital. Age: Pleistocene, less than 2.6 million years old. About 3 mi of the line.

Pre-Cenozoic granitic and metamorphic rocks undivided

Plutonic, gneiss. Age: Paleoproterozoic to Late Cretaceous, 66 to 2,500 million years old. About 2 mi of the line.

Quaternary alluvium and marine deposits

Coarse-detrital. Age: Pleistocene to Holocene, less than 2.6 million years old. About 2 mi of the line.

Pre-Cenozoic metasedimentary and metavolcanic rocks undivided

Schist, gneiss. Age: Paleoproterozoic to Cretaceous, 66 to 2,500 million years old. About 0.9 mi of the line.

Mesozoic granitic rocks, unit 2 (Peninsular Ranges)

Tonalite. Age: Middle Jurassic to Late Cretaceous, 66 to 175 million years old. About 0.8 mi of the line.

From the USGS State Geologic Map Compilation (Horton and others, 2017), the states’ geologic maps joined at a common scale. 1 smaller unit along the line are not listed.

Heights from Copernicus GLO-90 (a surface model: it includes buildings and tree canopy); summits from USGS GNIS; rivers from USGS NHDPlus HR; rock from the USGS State Geologic Map Compilation.

MILE3
THE WATER

Where Desert Shores’s rain goes

Rain that falls on Desert Shores runs straight into Salton Sea. Salton Sea has no outlet to the sea: the water leaves only by evaporating or soaking into the ground.

FROM THE CENTER OF DESERT SHORES < 2 mi to Salton Sea straight to the shore

Traced down the USGS NHDPlus V2.1 river network from the Census center point of Desert Shores; river miles along the main stem, rounded.

MILE5
THE ALMANAC

Desert Shores’s year

1991–2020 normals · records since 1950 · Desert Resorts Regional Airport, 17 mi north-northwest

Desert Shores has a hot desert climate. Summer afternoons average 107° in July; winter nights fall to about 38° in December. About 3 inches of rain fall in a normal year.

71°39°74°43°81°49°87°55°95°63°103°69°107°76°106°75°102°68°91°57°79°45°69°38° JANFEBMARAPRMAYJUNJULAUGSEPOCTNOVDEC 12 TODAY 3.0 in rain a year
Normal high to low, by month Record high to low, by day Rain by month
July, average107° / 76°high / low, the warmest month
December, average69° / 38°high / low, the coldest month
Rain a year3.0 inwettest months: January and February
Hottest on record126°FJuly 28, 1995
Coldest on record0°FDecember 29, 2025
Wettest day on record3.23 inSeptember 10, 1976
90° days a year187about 120 of them 100° or more
Nights at or below 32°19a year, on average
Climate typeHot desertKöppen BWh

AROUND THE RING

1Freeze seasonfrom the first fall freeze, about Dec. 1, to the last in spring, about Feb. 12 (median dates)
2Highs of 90° and upApril 28 to Oct. 20; normal highs reach 90°
NOVEMBER 14 IN THE RECORD

On November 14 Desert Shores normally reaches 79° and falls to 45°. The record high is 93°, in 2008; the record low 25°, in 1994. The most rain on this date, 0.24 in, fell in 1993.
MONTH BY MONTH
JanFebMarAprMayJunJulAugSepOctNovDec
Normal high71°74°81°87°95°103°107°106°102°91°79°69°
Normal low39°43°49°55°63°69°76°75°68°57°45°38°
Rain, inches0.640.610.340.080.010.010.130.120.320.190.170.34
Record high94° (2003)100° (1986)108° (2026)110° (1989)116° (1983)123° (2017)126° (1995)122° (2021)123° (1950)114° (1980)98° (2020)93° (1958)
Record low17° (2007)19° (2011)24° (2002)32° (1999)41° (1951)50° (2011)57° (1994)52° (1999)48° (1993)28° (1971)20° (2010)0° (2025)

Normals 1991–2020 and records since 1950 at Desert Resorts Regional Airport, 17 miles north-northwest. NOAA, through RCC-ACIS.

MILE7
ON THE NETWORK

Around Desert Shores on the Forecast Network

Neighboring plates

Indio CA · 25 MI 25 miles northwest Palm Desert CA · 30 MI 30 miles northwest San Diego CA · 75 MI 75 miles southwest Anaheim CA · 104 MI 104 miles west Long Beach CA · 125 MI 125 miles west Los Angeles CA · 143 MI 143 miles west
FORECASTCITY
Map of Desert Shores, California. Explore the plate
CALIFORNIA · IMPERIAL

Desert Shores

1,128 people, 210 ft below sea level in Imperial County.

-210 ftElevation
1,128People
1 sq miLand
Sunny 78°
SunnyDew point 50°
1

Today in Desert Shores

NEXT 15 HOURS
Now clear day 78° 0%
5p clear night 73° 0%
8p clear night 64° 0%
11p clear night 61° 0%
2a clear night 58° 0%
5a clear night 55° 0%
Partly cloudy
NEXT RAINThursday · 30%
→
Sat0%
Sunny Sunny
51
78
A
Sun0%
Mostly sunny Mostly sunny
52
79
A
Mon0%
Mostly sunny Mostly sunny
50
79
B
Tue10%
Sunny Sunny
45
75
B
Wed0%
Mostly sunny Mostly sunny
45
73
B
Thu30%
Partly cloudy Partly cloudy
44
73
B
Fri10%
Sunny Sunny
43
72
C
Letters show how sure the forecast is: A, models agree; B, some spread; C, check back. Sample data.
THIS WEEK IN 1999 · NOV. 12, 1999

96°, the hottest this week of the year has been since 1950.

2

What Desert Shores stands on

Desert Shores’s center stands about 210 ft below sea level. Within three miles the land runs from -230 ft to 1,740 ft, a difference of 1,970 ft: steep hill country. The highest named summit within 15 miles is Rabbit Peak, about 6,640 ft, 12 miles west.

Desert Shores, west to east Desert Shores-210 ft ← WE → 24 miles through the town center; vertical exaggeration about 7×. Colors: rock at the surface.
Elevation, center-210 ft
Within 3 miles-230 to 1,740 ft
Lie of the landSteep hill country (1,970 ft of relief)
High point nearbyRabbit Peak, 6,640 ft, 12 mi west
Rock at the surfaceQuaternary alluvium and marine deposits
Its agePleistocene to Holocene, less than 2.6 million years old
5

Desert Shores’s year

Desert Shores has a hot desert climate. Summer afternoons average 107° in July; winter nights fall to about 38° in December. About 3 inches of rain fall in a normal year.

JANFEBMARAPRMAYJUNJULAUGSEPOCTNOVDEC 12 3.0 in
July, average107° / 76° · high / low, the warmest month
December, average69° / 38° · high / low, the coldest month
Rain a year3.0 in · wettest months: January and February
Hottest on record126°F · July 28, 1995
Coldest on record0°F · December 29, 2025
Wettest day on record3.23 in · September 10, 1976
90° days a year187 · about 120 of them 100° or more
Nights at or below 32°19 · a year, on average
Climate typeHot desert · Köppen BWh
1Freeze season · from the first fall freeze, about Dec. 1, to the last in spring, about Feb. 12 (median dates)
2Highs of 90° and up · April 28 to Oct. 20; normal highs reach 90°
NOVEMBER 14 IN THE RECORD

On November 14 Desert Shores normally reaches 79° and falls to 45°. The record high is 93°, in 2008; the record low 25°, in 1994. The most rain on this date, 0.24 in, fell in 1993.

Normals 1991–2020 and records since 1950 at Desert Resorts Regional Airport, 17 miles north-northwest. NOAA, through RCC-ACIS.
3

Where the rain goes

< 2 mito Salton Seastraight to the shore

Rain that falls on Desert Shores runs straight into Salton Sea. Salton Sea has no outlet to the sea: the water leaves only by evaporating or soaking into the ground.