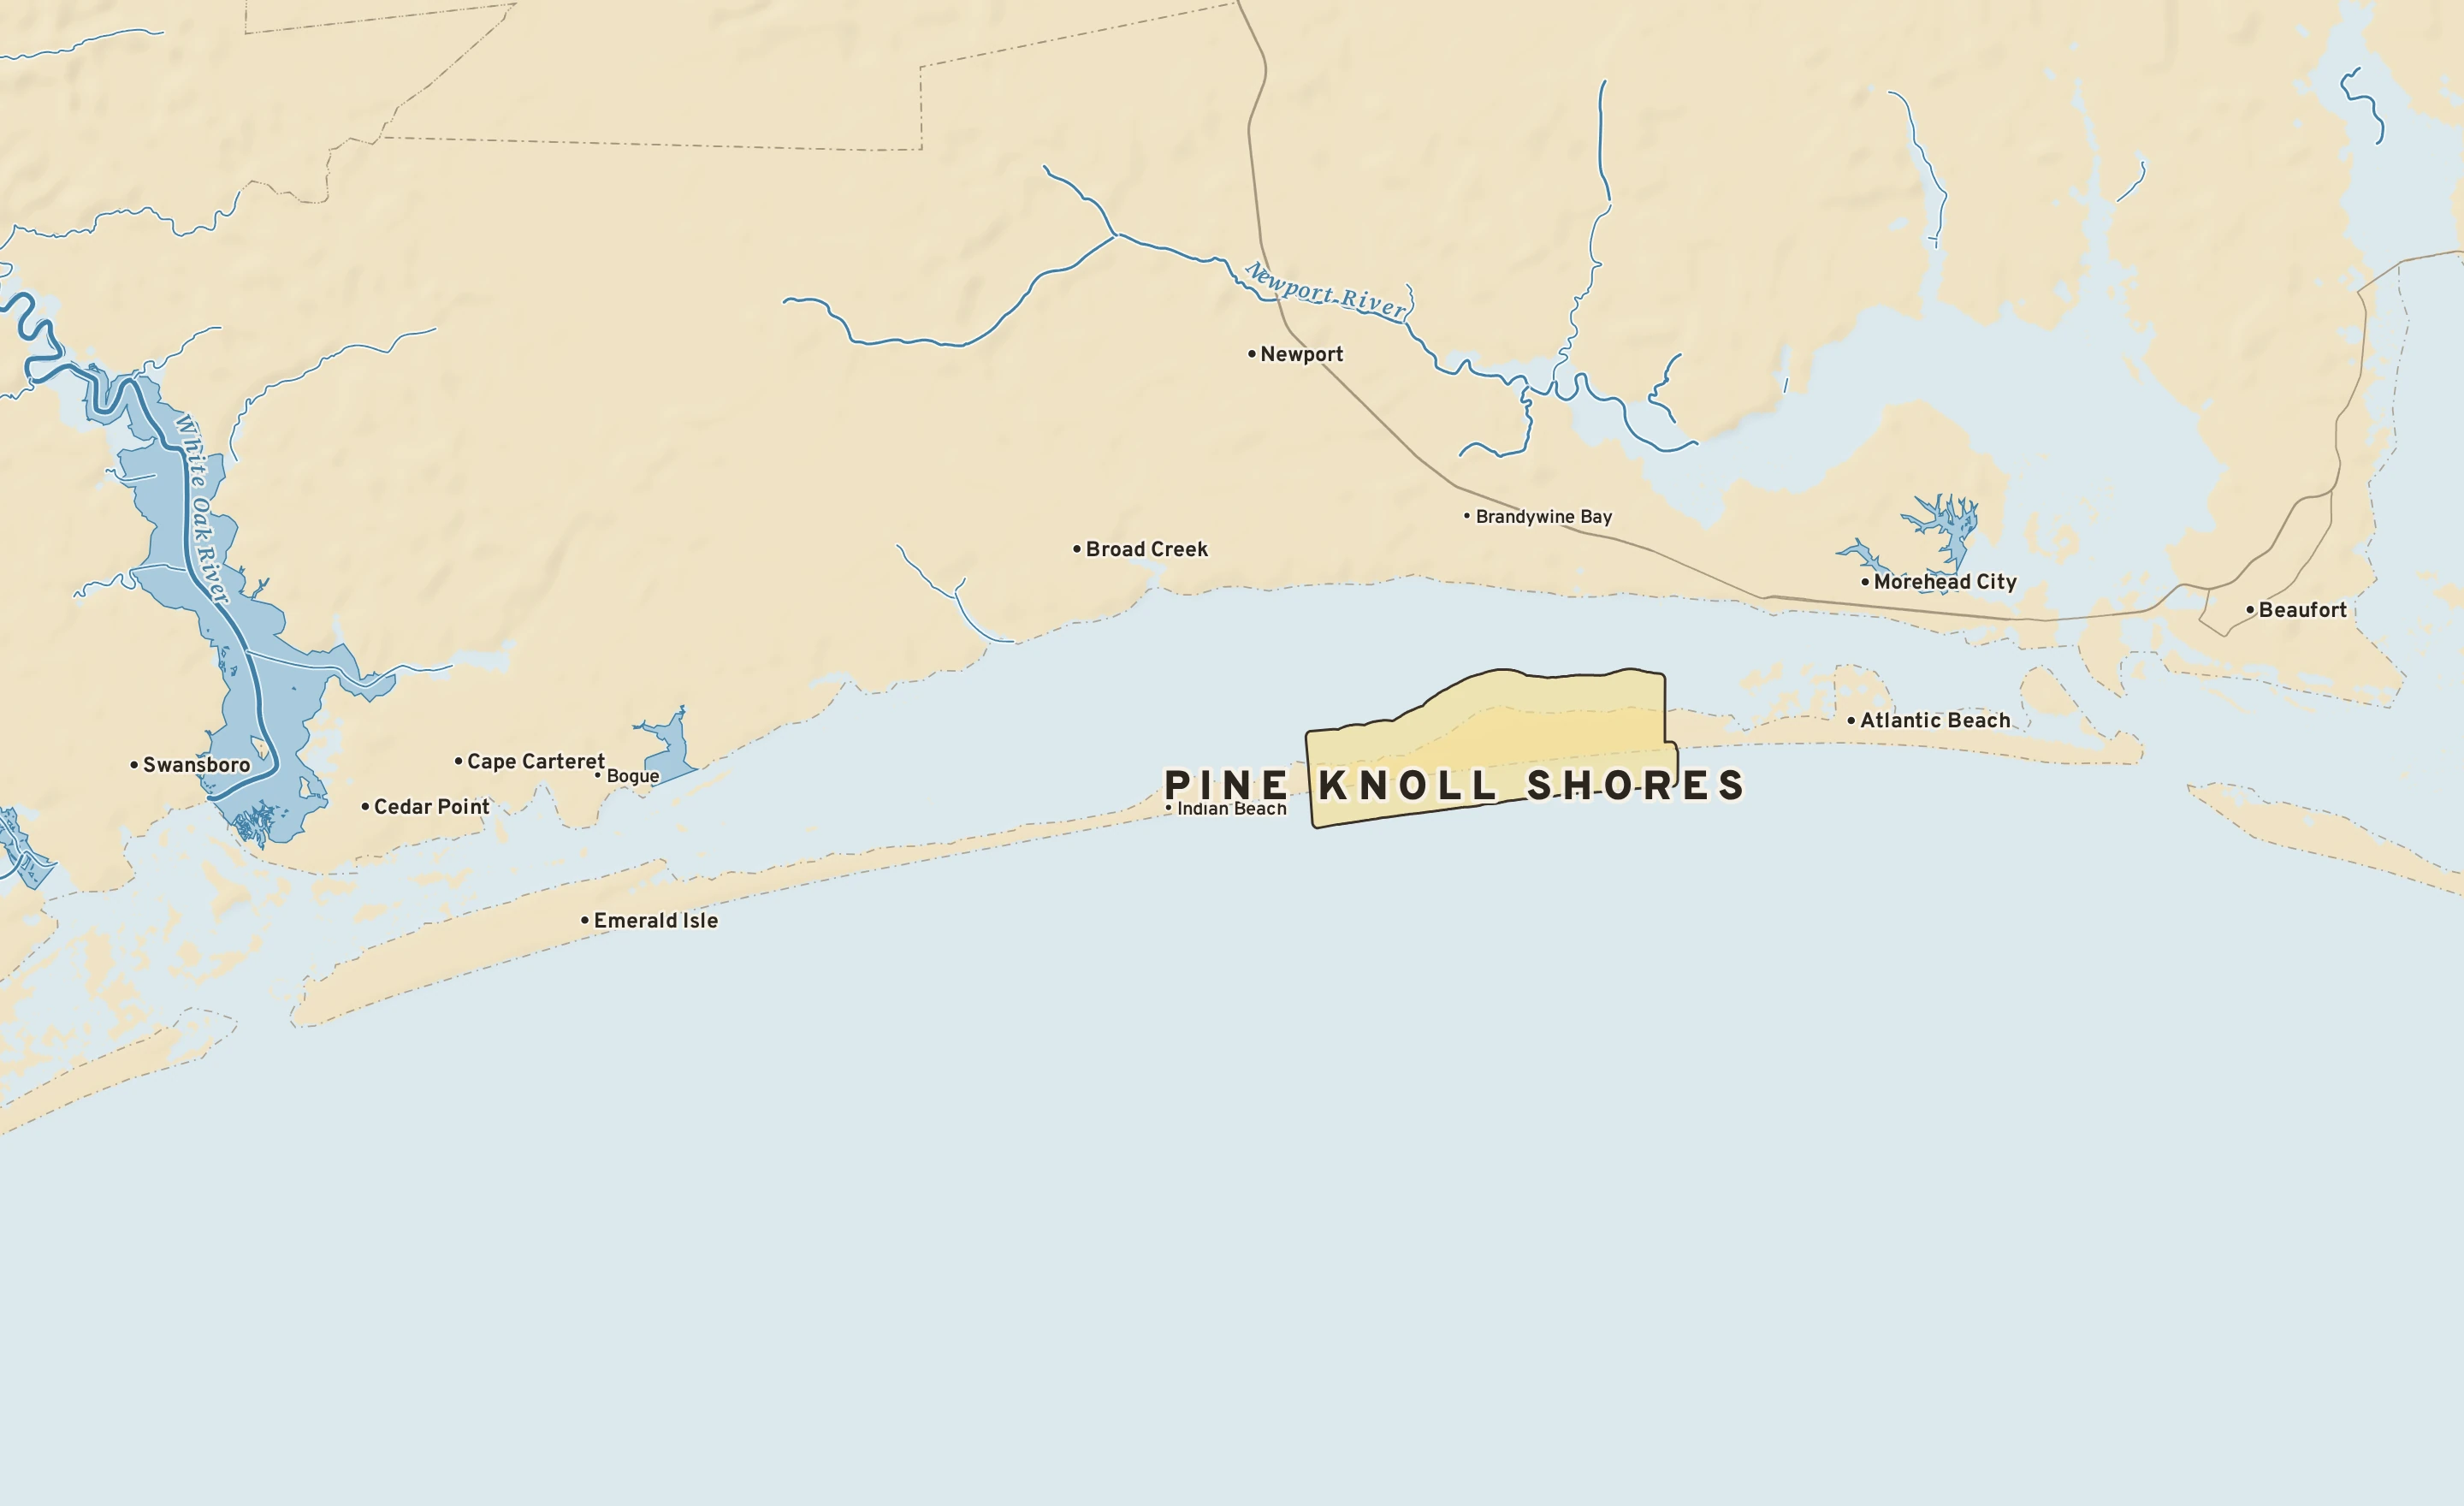
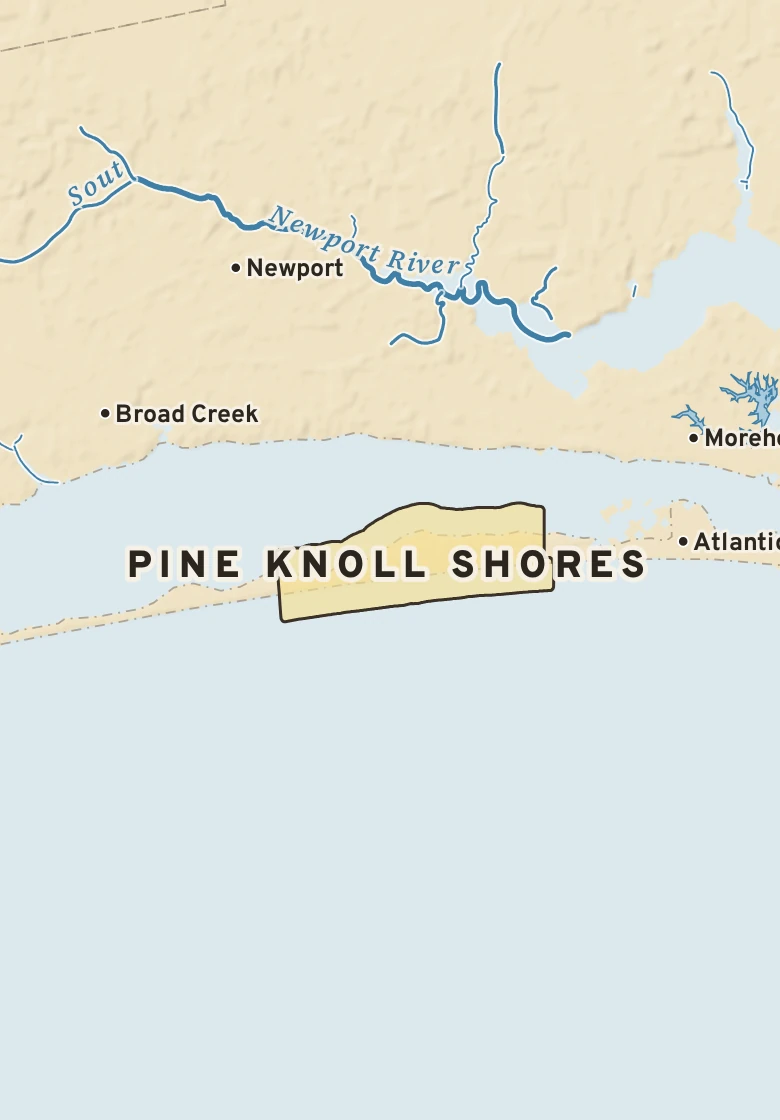
Pine Knoll Shores has a humid subtropical climate. Summer afternoons average 86° in July; winter nights fall to about 36° in January. About 61 inches of rain fall in a normal year.
July, average86° / 74° · high / low, the warmest month
January, average55° / 36° · high / low, the coldest month
Rain a year61.2 in · wettest months: September and August
Snow a year0.5 in · snowiest: January
Hottest on record103°F · June 30, 1959
Coldest on record1°F · January 21, 1985
Wettest day on record9.15 in · September 15, 2018
Snowiest day on record22.0 in · March 3, 1980
90° days a year11 · none reach 100°
Nights at or below 32°36 · a year, on average
Climate typeHumid subtropical · Köppen Cfa
1Freeze season · from the first fall freeze, about Nov. 24, to the last in spring, about March 17 (median dates)
NOVEMBER 14 IN THE RECORDOn November 14 Pine Knoll Shores normally reaches 66° and falls to 46°. The record high is 78°, in 2020; the record low 24°, in 1976. The most rain on this date, 1.36 in, fell in 1972.