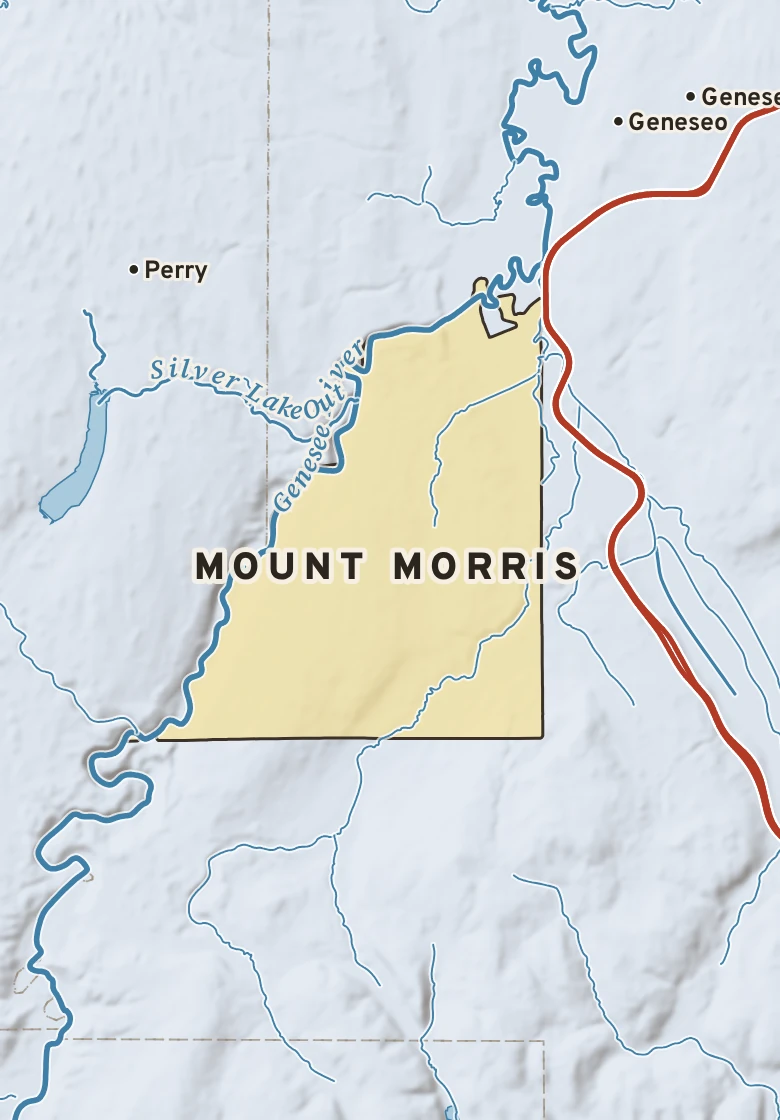
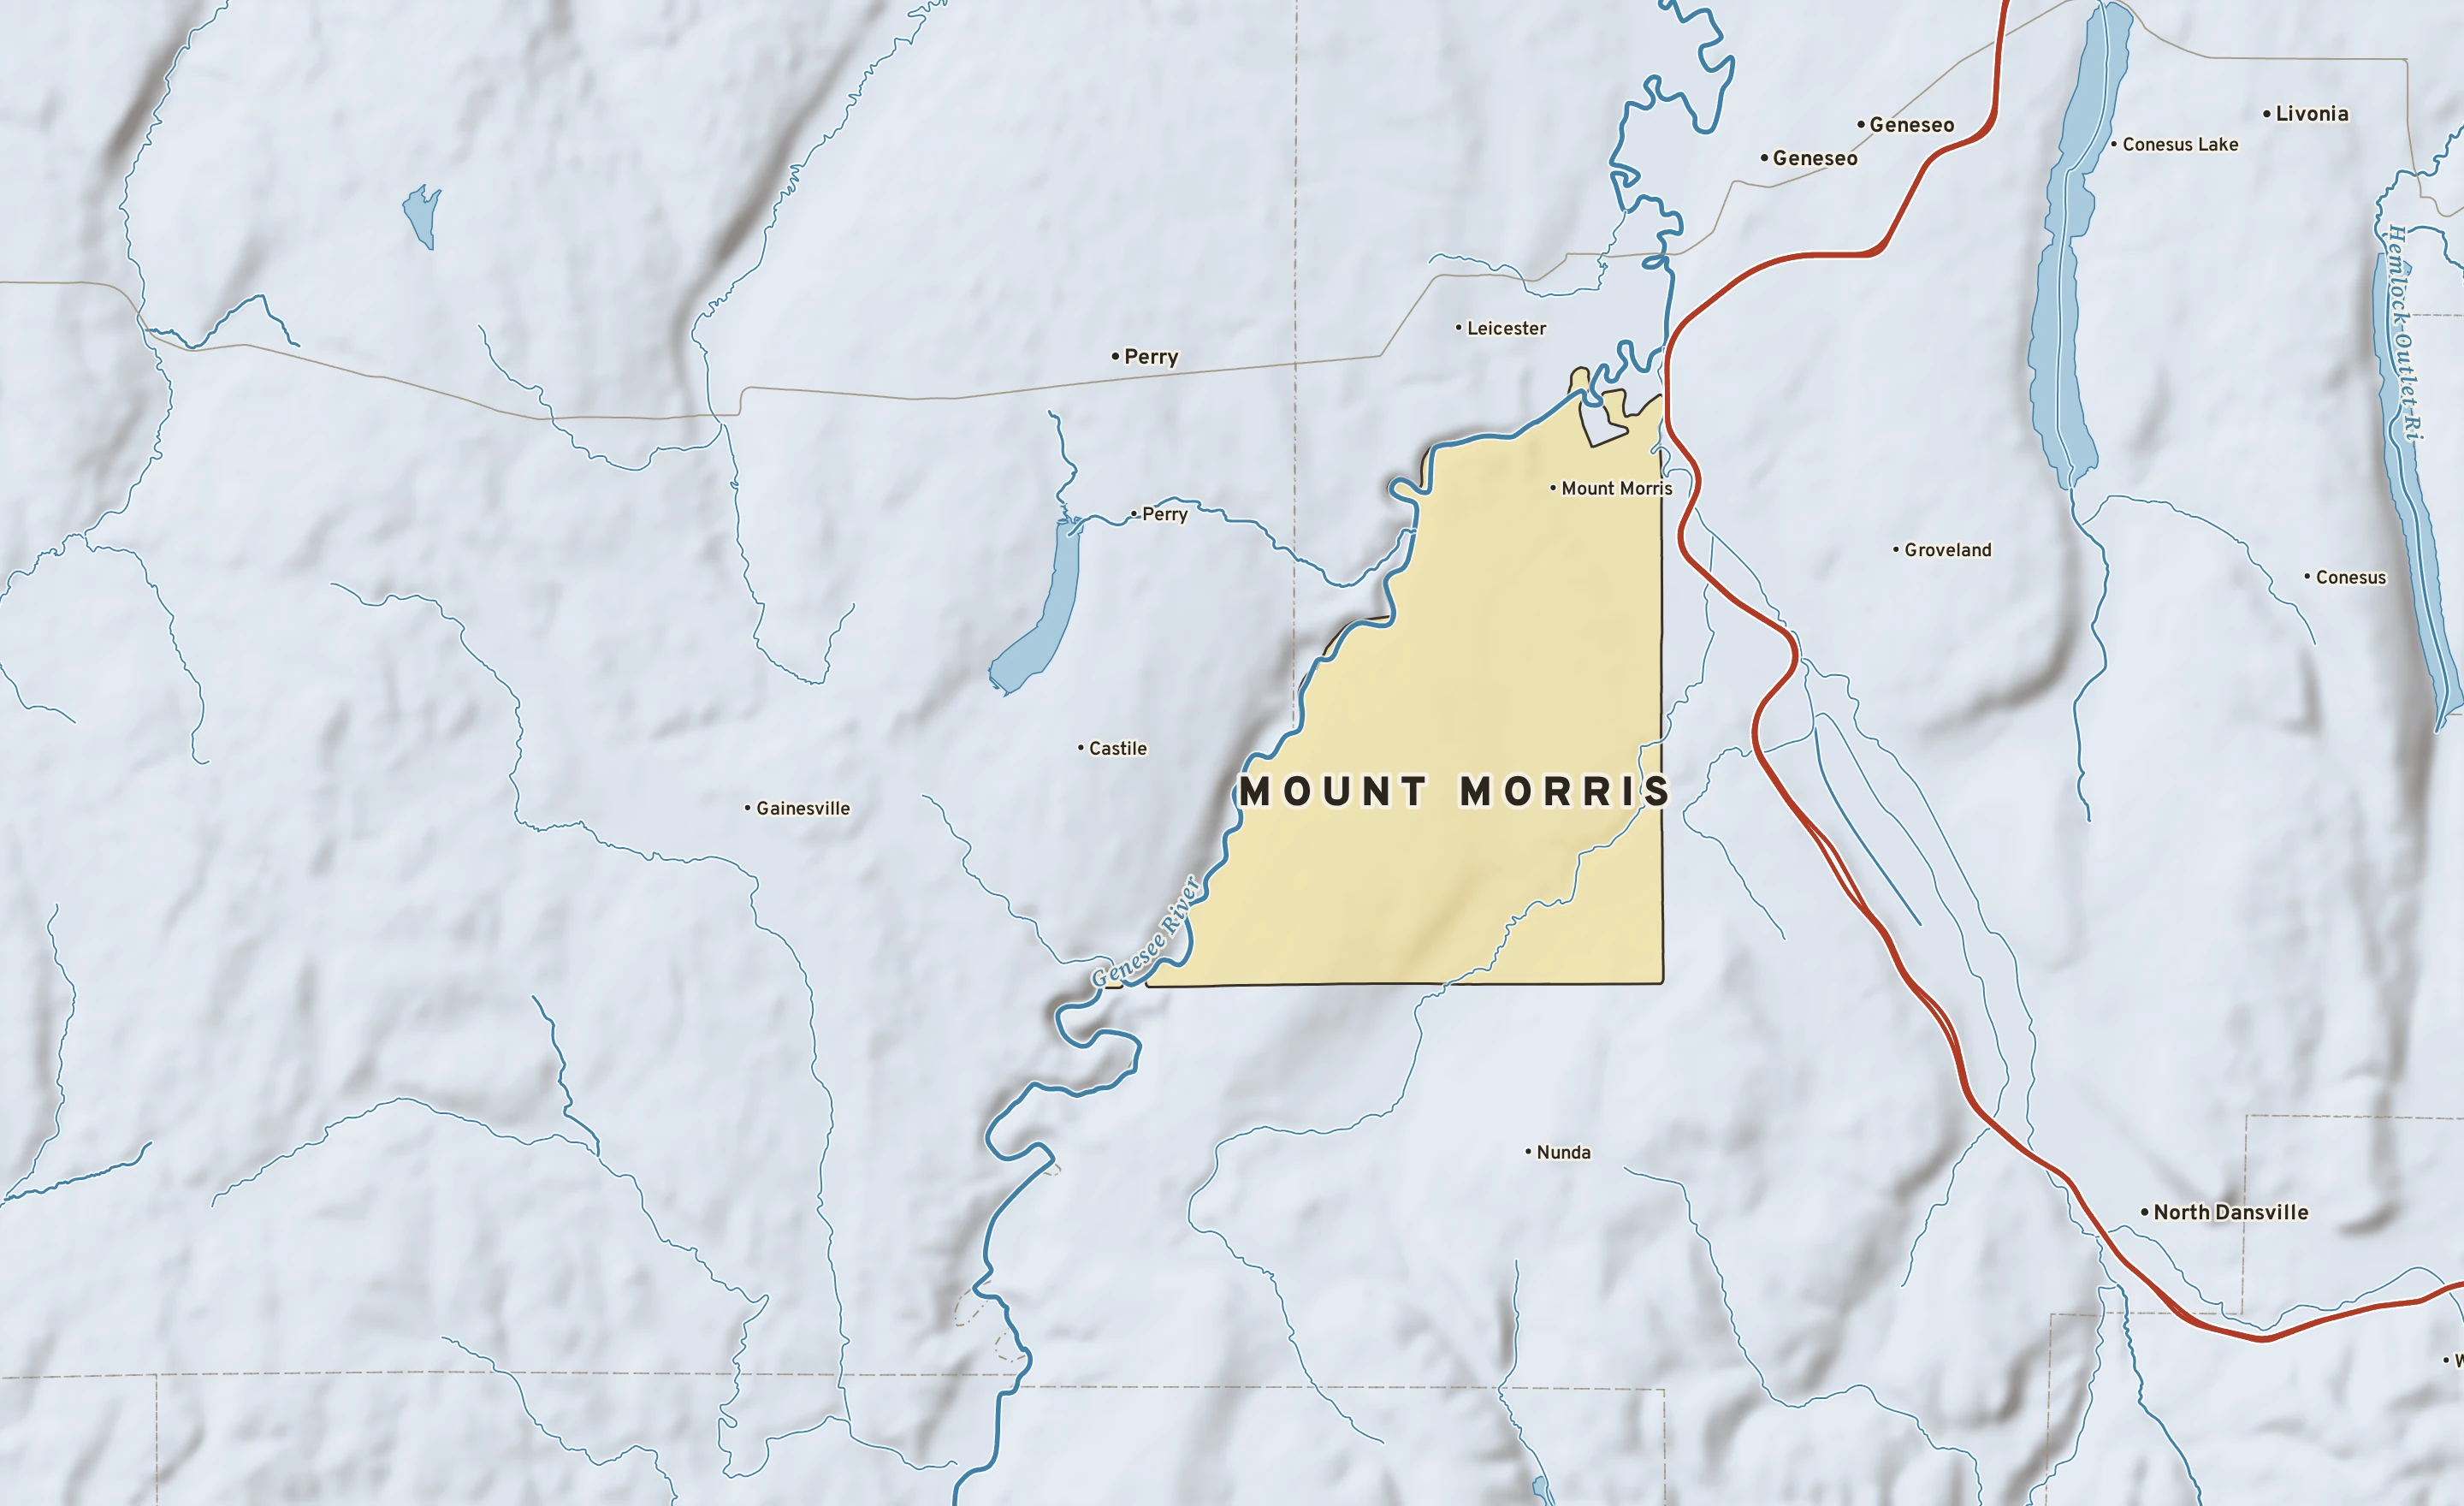
The Mount Morris plate. Relief from Copernicus GLO-30; rivers and lakes from USGS NHD; watersheds from the USGS Watershed Boundary Dataset; roads and city limits from Census TIGER 2024.
79° on Nov. 12, 2020, the hottest reading for this week of the year since 1893. Next is 78° in 1896.
Mount Morris’s center stands about 1,110 ft above sea level. Within three miles the land runs from 620 ft to 1,280 ft, a difference of 660 ft: hilly country. The highest named summit within 15 miles is East Hill, about 2,090 ft, 11 miles south.
Under the town center the state geologic map shows West Hill and Gardeau Formations (shale, siltstone), from the Late Devonian, 359 to 384 million years old.
The section below crosses 9 rock units mapped at the surface.
Heights every 0.1 mile from the Copernicus GLO-90 surface model; vertical exaggeration about 13×. The colored band under the surface is the rock the state geologic map shows at the surface, not a picture of what lies beneath.
Shale, siltstone. Age: Late Devonian, 359 to 384 million years old. About 9 mi of the line.
Shale, limestone. Age: Middle Devonian, 384 to 388 million years old. About 4 mi of the line.
Shale. Age: Middle Devonian, 384 to 388 million years old. About 3 mi of the line.
Shale, siltstone, sandstone. Age: Late Devonian, 359 to 384 million years old. About 3 mi of the line.
Sandstone. Age: Late Devonian, 359 to 384 million years old. About 2 mi of the line.
Shale. Age: Late Devonian, 359 to 384 million years old. About 1 mi of the line.
From the USGS State Geologic Map Compilation (Horton and others, 2017), the states’ geologic maps joined at a common scale. 3 smaller units along the line are not listed.
Heights from Copernicus GLO-90 (a surface model: it includes buildings and tree canopy); summits from USGS GNIS; rivers from USGS NHDPlus HR; rock from the USGS State Geologic Map Compilation.
A raindrop that lands in Mount Morris reaches Lake Ontario by way of Buck Run Creek, Canaseraga Creek and the Genesee: about 70 river miles. From the lake it goes down the St. Lawrence to the Atlantic.
Traced down the USGS NHDPlus V2.1 river network from the Census center point of Mount Morris; river miles along the main stem, rounded.
Mount Morris has a warm-summer humid continental climate. Summer afternoons average 81° in July; winter nights fall to about 15° in January. About 33 inches of rain fall in a normal year.
On November 14 Mount Morris normally reaches 49° and falls to 32°. The record high is 73°, in 2011; the record low 15°, in 2019. The most rain on this date, 0.67 in, fell in 1972.
Normals 1991–2020 and records since 1893 at Mount Morris 2 W, 5 miles north, 230 ft lower. NOAA, through RCC-ACIS.