FORECAST CITY
Sign in
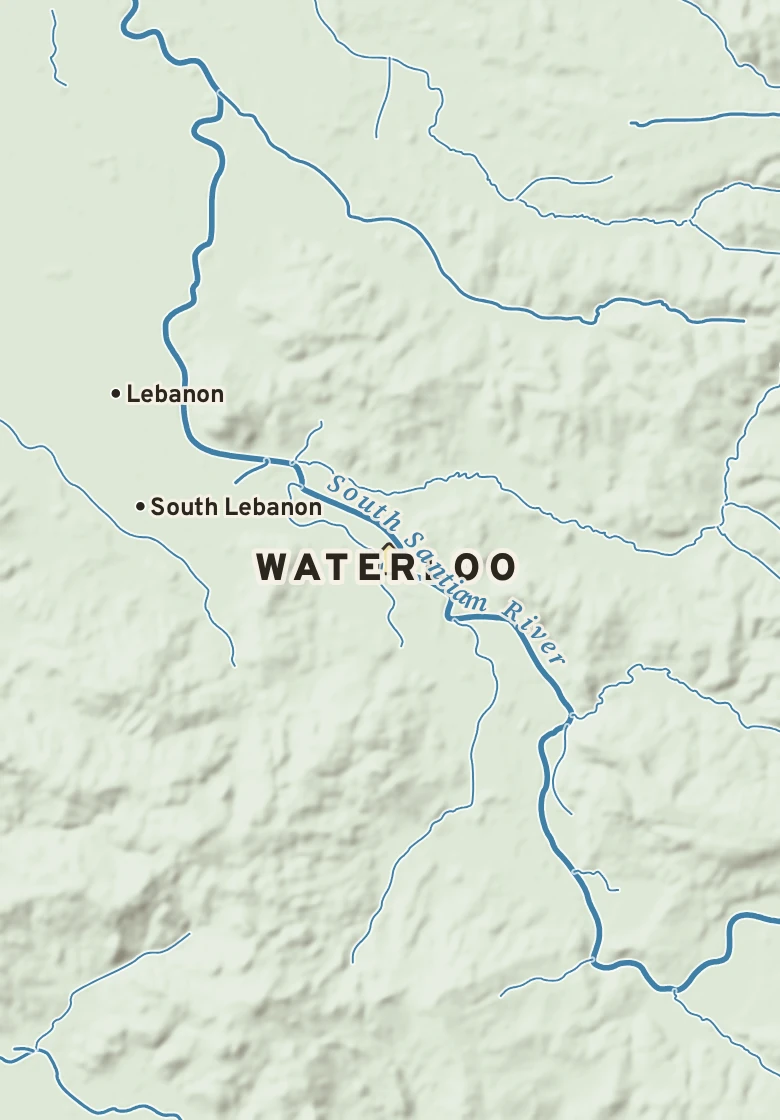
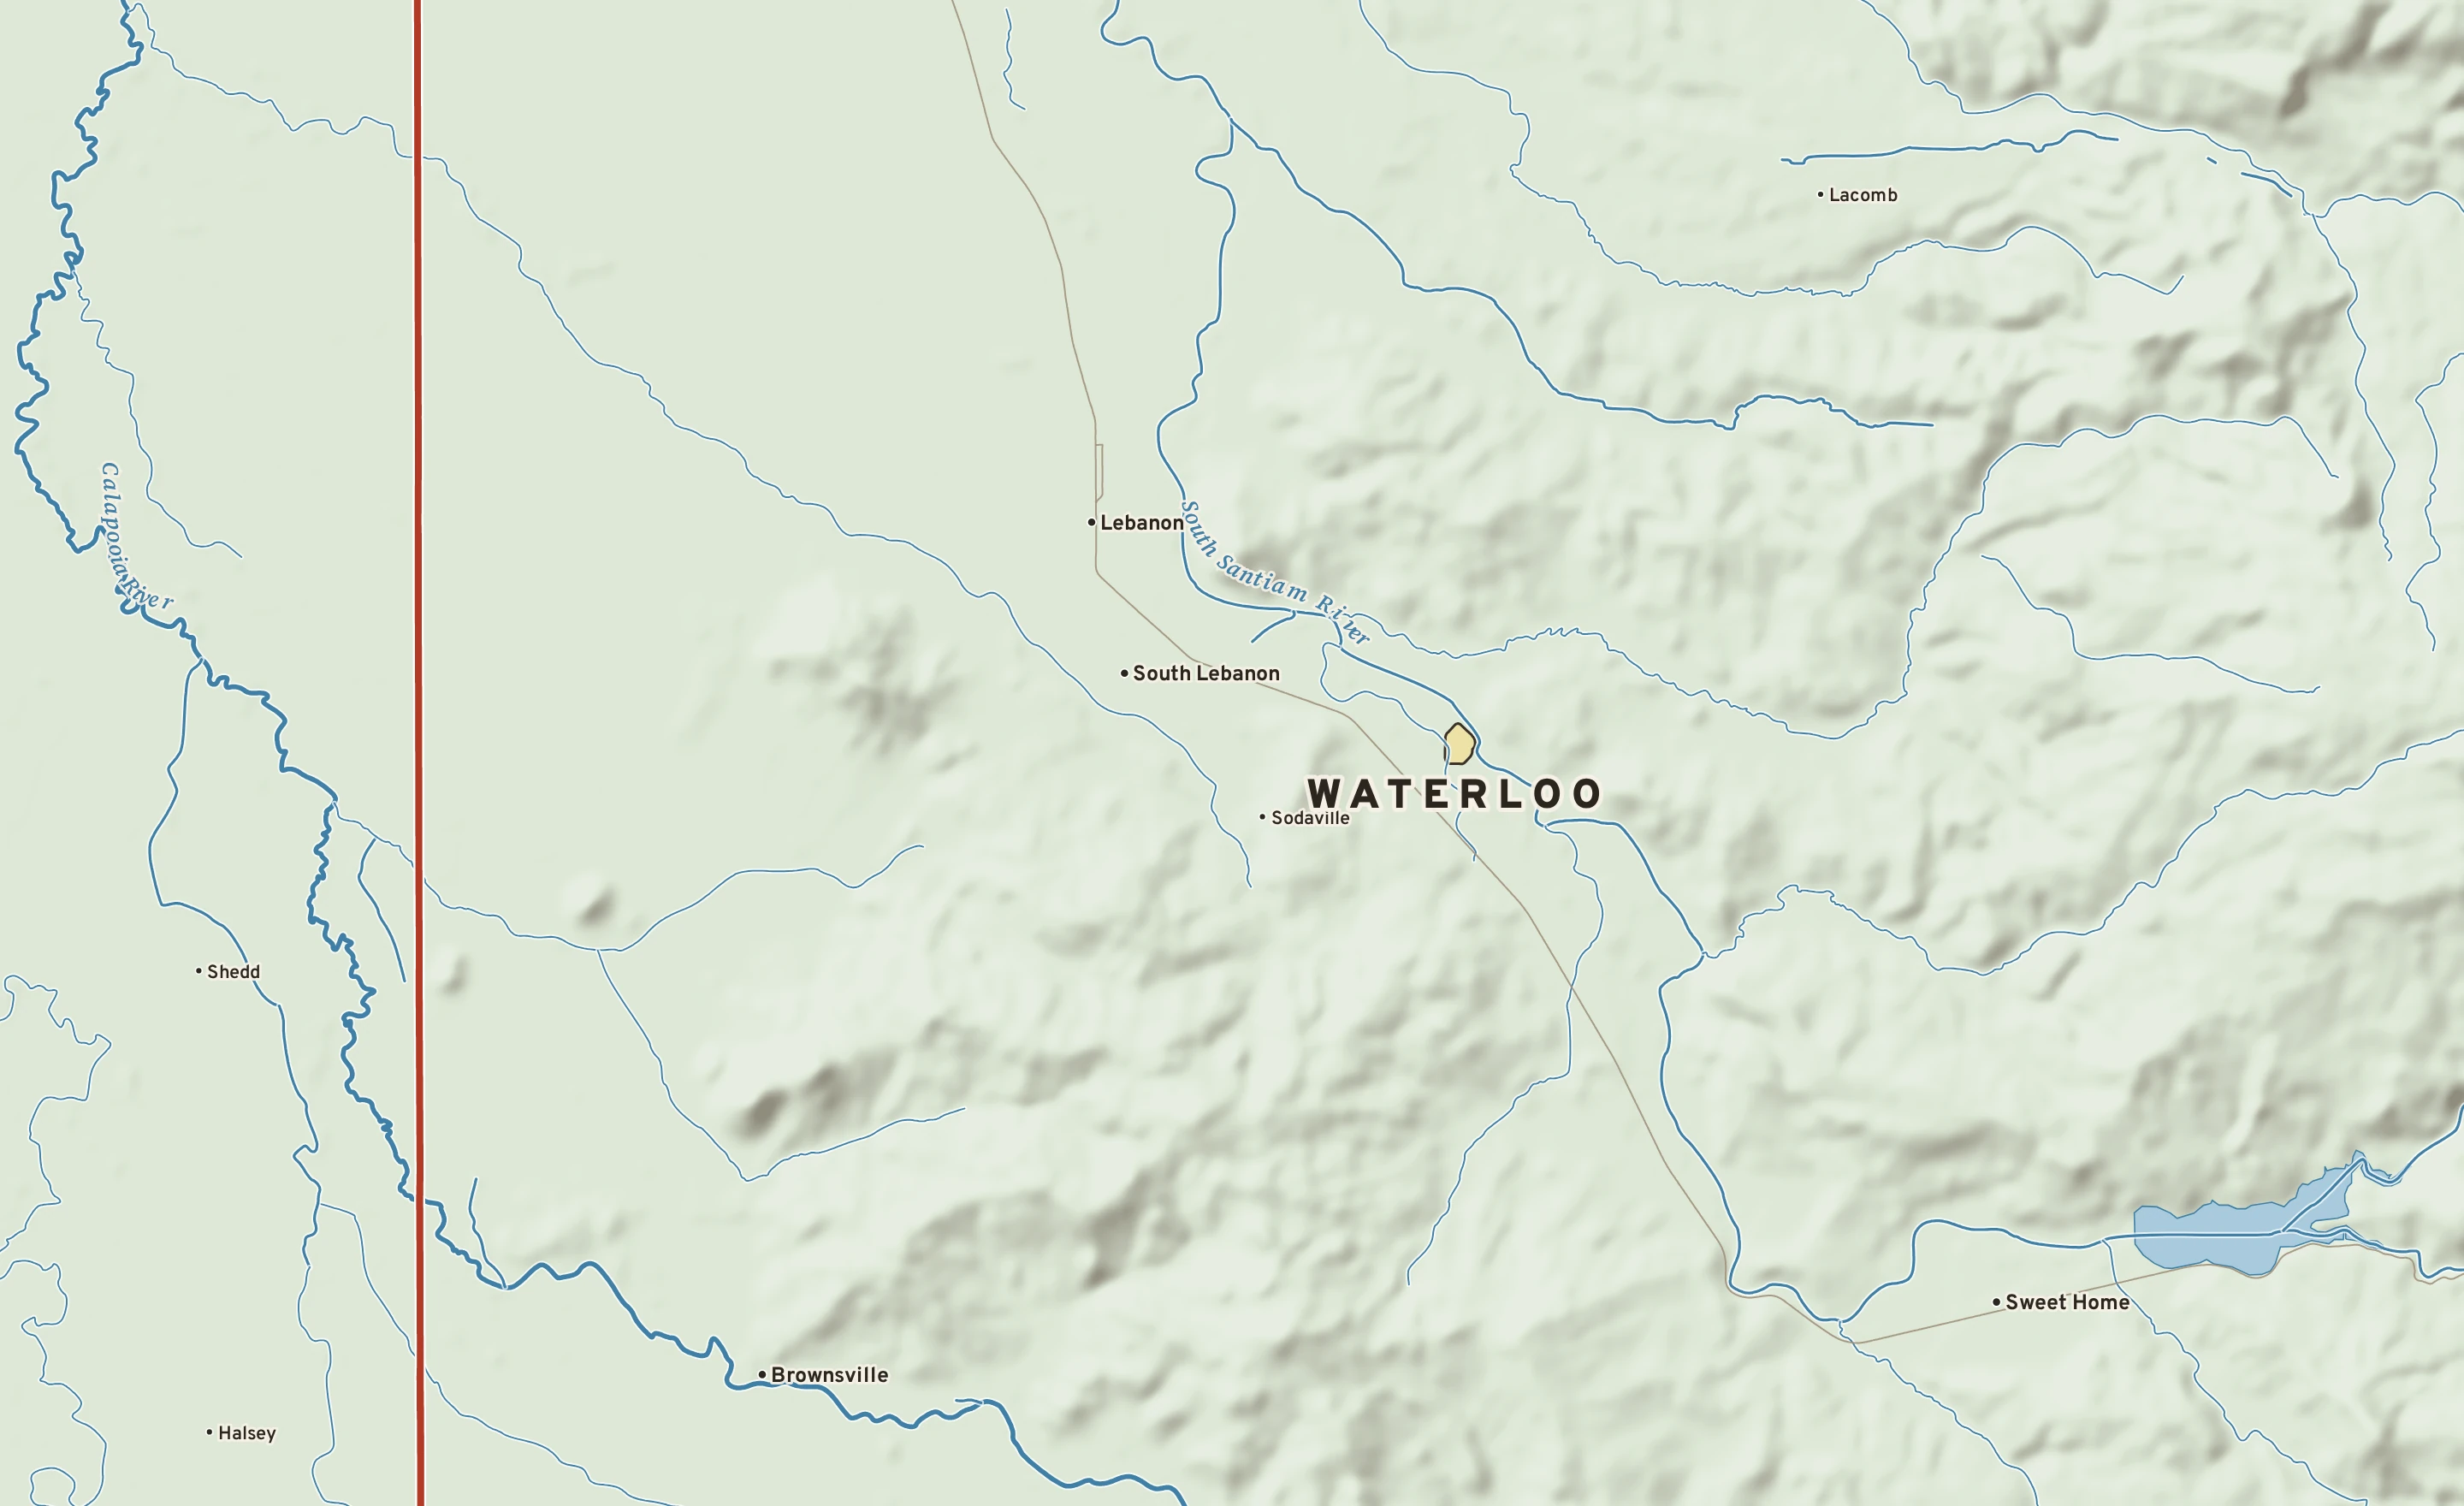
Shaded-relief map of Waterloo, Oregon: rivers, roads, the city limits and where the water drains.
OREGON · LINN COUNTY

Waterloo

226 people, 410 ft above sea level in Linn County.

410 ftElevation, city center
226People, 2024 estimate
0 sq miLand area
Sunny 57°
Sunny now Dew point 48° · N 5 mph · high 57°
City of Waterloo River Interstate 2 miles
Explore the plate Order a print

The Waterloo plate. Relief from Copernicus GLO-30; rivers and lakes from USGS NHD; watersheds from the USGS Watershed Boundary Dataset; roads and city limits from Census TIGER 2024.

MILE1
TODAY

Today in Waterloo

NWS forecast and National Blend of Models · updated 1:00 PM PST
RIGHT NOW Albany Municipal Airport (KS12) · 1:55 PM
Sunny
57° Sunny Feels like 57° · high of 57° near 2 PM
WindN 5 mphno gusts
Humidity72%falling to 74% this afternoon
Pressure29.70 in →steady
Visibility10 mihaze-free
CloudsClear
UV index—no forecast
Dew point 48° · Dry37° by Tuesday: drier air arrives
DryComfortableStickyMuggyOppressive
NEXT RAIN
Rain
Tonight, about 9 PMin about 7 hours · 79% chance · rain
LIKELY AMOUNT—amounts come within 3 days
LAST RAINNov. 100.83 in · 4 dry days
ALERTS & OUTLOOKS
No watches or warnings for Linn County
NWS Portland and the Storm Prediction Center · checked 2:17 PM
SUN & MOON
↑ 7:06 AM4:45 PM ↓
9 h 38 m of daylight, 2 minutes less than yesterday
Waxing crescent, 26% lit. Next full moon: Nov. 24.
AIR & POLLEN
2
GOODAir quality index · fine particles
No pollen source yet.

The next three days, hour by hour

Sky: clear, cloudy, night Rain likely National Blend of Models
SATURDAY, NOV. 14
SUNDAY, NOV. 15
MONDAY, NOV. 16
TUESDAY, NOV. 17
2p
5p
8p
11p
2a
5a
8a
11a
2p
5p
8p
11p
2a
5a
8a
11a
2p
5p
8p
11p
2a
5a
8a
11a
mostly cloudy day
partly cloudy night
rain
rain
rain
rain
partly cloudy day
partly cloudy day
showers day
partly cloudy night
mostly clear night
partly cloudy night
partly cloudy night
partly cloudy night
partly cloudy day
showers day
showers day
showers night
showers night
partly cloudy night
partly cloudy night
partly cloudy night
partly cloudy day
partly cloudy day
TEMPERATURE °F
57°
50°
53°
42°
51°
37°
CHANCE OF RAIN
79% · 0.25 in Sunday overnight 50%
WIND, MPH
8
7
10
13
12
9
10
10
7
5
5
5
4
3
5
6
3
1
2
2
2
2
1
2
HOW IT FEELS · DEW POINT
Dry: dew points 38 to 51° ↑ Humid air returns Drier: 45° by Tuesday

The next seven days, and how sure we are

Forecast, with the range 8 in 10 ensemble members agree on Normal, about 80° / 62°
SAT Nov. 14 Chance of showers Chance of showers
57° 47°
50% rain — S 8 A
SUN Nov. 15 Showers likely Showers likely
55° 39°
80% rain 0.1–0.3″ S 9 B
MON Nov. 16 Chance of showers Chance of showers
52° 35°
40% rain up to 0.1″ S 4 B
TUE Nov. 17 Chance of showers Chance of showers
52° 38°
50% rain up to 0.1″ E 1 B
WED Nov. 18 Chance of showers Chance of showers
50° 34°
40% rain up to 0.1″ N 5 C
THU Nov. 19 Partly cloudy Partly cloudy
50° 33°
10% rain — N 1 B
FRI Nov. 20 Partly cloudy Partly cloudy
50° 33°
20% rain — SSE 5 C
How sure are we? AModels agree: highs within 4° BSome spread: within 8° CWide spread: check back
Range from the National Blend of Models percentiles · graded on Forecast Scores
AIR MAIL

Where today’s air came from

The air arriving over Waterloo about 5,000 feet above the ground was over the open Pacific three days ago, and over the Pacific Northwest a day ago, about 1,250 miles back along its path. It came down from about 12,300 feet up, warming and drying as it sank. Near the ground the air came from the Pacific off the Northwest; at 10,000 feet, from the Pacific north of Hawaii. Traced back 72 hours through NOAA’s hourly RAP analyses and the GFS beyond them, nine paths at each of three heights.

THIS WEEK IN 1999 Nov. 14, 1999

The hottest this week has been

74° on Nov. 14, 1999, the hottest reading for this week of the year since 1969. Next is 73° in 2021.

73°
74°
20211999
Source: NOAA RCC-ACIS, the Foster Dam record since 1969.
MILE2
THE GROUND

What Waterloo stands on

Waterloo’s center stands about 410 ft above sea level. Within three miles the land runs from 370 ft to 1,160 ft, a difference of 790 ft: hilly country. The highest named summit within 15 miles is Bald Peter, about 4,040 ft, 12 miles east.

Under the town center the state geologic map shows Alluvial deposits (sand, gravel, silt), from the Holocene, less than 12,000 years old.

The section below crosses 8 rock units mapped at the surface.

Waterloo, cut in half from west to east

A section west to east, 24 miles through the town center
0 ft1,000 ft2,000 ft3,000 ft WATERLOO410 ftLow point260 ftSouth Lebanon380 ftSodaville420 ftBald Peter4,040 ft ← WE →

Heights every 0.1 mile from the Copernicus GLO-90 surface model; vertical exaggeration about 6×. The colored band under the surface is the rock the state geologic map shows at the surface, not a picture of what lies beneath.

Rock at the surface along the line

Undifferentiated tuffaceous sedimentary rocks, tuffs, and basalt

Basalt, basaltic-andesite. Age: Oligocene to Miocene, 5.3 to 34 million years old. About 9 mi of the line.

Lacustrine and fluvial sedimentary rocks

Clay, silt, sand. Age: Pleistocene, less than 2.6 million years old. About 4 mi of the line.

Sedimentary and volcaniclastic rocks

Mafic-volcanic, felsic-volcanic, clastic. Age: Tertiary, 2.6 to 66 million years old. About 3 mi of the line.

Basaltic lava flows

Basalt, basaltic-andesite. Age: Oligocene to Miocene, 5.3 to 34 million years old. About 2 mi of the line.

Terrace, pediment, and lag gravels

Gravel, boulders, clay. Age: Pleistocene to Holocene, less than 2.6 million years old. About 2 mi of the line.

Alluvial deposits

Sand, gravel, silt. Age: Holocene, less than 12,000 years old. About 2 mi of the line.

From the USGS State Geologic Map Compilation (Horton and others, 2017), the states’ geologic maps joined at a common scale. 2 smaller units along the line are not listed.

Heights from Copernicus GLO-90 (a surface model: it includes buildings and tree canopy); summits from USGS GNIS; rivers from USGS NHDPlus HR; rock from the USGS State Geologic Map Compilation.

MILE3
THE WATER

Where Waterloo’s rain goes

A raindrop that lands in Waterloo reaches the Pacific Ocean by way of Vail Creek, the South Santiam, the Santiam, the Willamette and the Columbia: about 240 river miles.

THE WAY DOWN, TO SCALE
Waterloo≈ 240 mi · the Pacific Ocean
FROM THE CENTER OF WATERLOO ≈ 240 mi to the Pacific Ocean Vail Creek → South Santiam → Santiam → Willamette → Columbia

Lake on the way: Willamette Falls Hydroelectric Power Reservoir.

100 miles of the trip are on the Columbia.

Traced down the USGS NHDPlus V2.1 river network from the Census center point of Waterloo; river miles along the main stem, rounded.

MILE5
THE ALMANAC

Waterloo’s year

1991–2020 normals · records since 1969 · Foster Dam, 9 mi southeast

Waterloo has a warm-summer Mediterranean climate. Summer afternoons average 83° in August; winter nights fall to about 34° in January. About 54 inches of rain fall in a normal year.

47°34°51°34°56°37°60°40°67°44°73°48°82°51°83°50°76°47°64°42°53°38°47°34° JANFEBMARAPRMAYJUNJULAUGSEPOCTNOVDEC 12 TODAY WATERLOO 54.5 in rain a year
Normal high to low, by month Record high to low, by day Rain by month
August, average83° / 50°high / low, the warmest month
January, average47° / 34°high / low, the coldest month
Rain a year54.5 inwettest months: December and November
Snow a year0.1 insnowiest: January
Hottest on record112°FJune 29, 2021
Coldest on record0°FJanuary 1, 1979
Wettest day on record4.60 inNovember 26, 1999
Snowiest day on record6.0 inJanuary 13, 1971
90° days a year16about 1 of them 100° or more
Nights at or below 32°53and 1 days that stay below freezing
Climate typeWarm-summer MediterraneanKöppen Csb

AROUND THE RING

1Freeze seasonfrom the first fall freeze, about Oct. 30, to the last in spring, about April 15 (median dates)
2Wettest stretchNovember through January: 23.2 of the year’s 54.5 inches
NOVEMBER 14 IN THE RECORD

On November 14 Waterloo normally reaches 53° and falls to 38°. The record high is 74°, in 1999; the record low 17°, in 1978. The most rain on this date, 1.95 in, fell in 2014.
MONTH BY MONTH
JanFebMarAprMayJunJulAugSepOctNovDec
Normal high47°51°56°60°67°73°82°83°76°64°53°47°
Normal low34°34°37°40°44°48°51°50°47°42°38°34°
Rain, inches7.155.566.265.373.802.460.540.641.994.647.648.40
Record high67° (1986)71° (1992)82° (2025)90° (2023)96° (1987)112° (2021)106° (2009)105° (2002)102° (1987)93° (1987)75° (1975)69° (1980)
Record low0° (1979)2° (1989)19° (2019)22° (2008)26° (2013)35° (2002)39° (2008)36° (1973)31° (2007)20° (2002)16° (1993)0° (1972)

Normals 1991–2020 and records since 1969 at Foster Dam, 9 miles southeast, 140 ft higher. NOAA, through RCC-ACIS.

MILE7
ON THE NETWORK

Around Waterloo on the Forecast Network

Neighboring plates

Salem OR · 31 MI 31 miles north Eugene OR · 34 MI 34 miles southwest Hillsboro OR · 71 MI 71 miles north Gresham OR · 72 MI 72 miles north Portland OR · 72 MI 72 miles north Vancouver WA · 80 MI 80 miles north
FORECASTCITY
Map of Waterloo, Oregon. Explore the plate
OREGON · LINN

Waterloo

226 people, 410 ft above sea level in Linn County.

410 ftElevation
226People
0 sq miLand
Sunny 57°
SunnyDew point 48°
1

Today in Waterloo

NEXT 15 HOURS
Now mostly cloudy day 57° 2%
5p partly cloudy night 56° 4%
8p mostly cloudy night 54° 22%
11p rain 53° 36%
2a rain 52° 68%
5a rain 51° 58%
Rain
NEXT RAINTonight about 9 PM · 79%
→
Sat50%
Chance of showers Chance of showers
47
57
A
Sun80%
Showers likely Showers likely
39
55
B
Mon40%
Chance of showers Chance of showers
35
52
B
Tue50%
Chance of showers Chance of showers
38
52
B
Wed40%
Chance of showers Chance of showers
34
50
C
Thu10%
Partly cloudy Partly cloudy
33
50
B
Fri20%
Partly cloudy Partly cloudy
33
50
C
Letters show how sure the forecast is: A, models agree; B, some spread; C, check back. Sample data.
THIS WEEK IN 1999 · NOV. 14, 1999

74°, the hottest this week of the year has been since 1969.

2

What Waterloo stands on

Waterloo’s center stands about 410 ft above sea level. Within three miles the land runs from 370 ft to 1,160 ft, a difference of 790 ft: hilly country. The highest named summit within 15 miles is Bald Peter, about 4,040 ft, 12 miles east.

Waterloo, west to east Waterloo410 ft ← WE → 24 miles through the town center; vertical exaggeration about 11×. Colors: rock at the surface.
Elevation, center410 ft
Within 3 miles370 to 1,160 ft
Lie of the landHilly (790 ft of relief)
High point nearbyBald Peter, 4,040 ft, 12 mi east
Rock at the surfaceAlluvial deposits
Its ageHolocene, less than 12,000 years old
5

Waterloo’s year

Waterloo has a warm-summer Mediterranean climate. Summer afternoons average 83° in August; winter nights fall to about 34° in January. About 54 inches of rain fall in a normal year.

JANFEBMARAPRMAYJUNJULAUGSEPOCTNOVDEC 12 54.5 in
August, average83° / 50° · high / low, the warmest month
January, average47° / 34° · high / low, the coldest month
Rain a year54.5 in · wettest months: December and November
Snow a year0.1 in · snowiest: January
Hottest on record112°F · June 29, 2021
Coldest on record0°F · January 1, 1979
Wettest day on record4.60 in · November 26, 1999
Snowiest day on record6.0 in · January 13, 1971
90° days a year16 · about 1 of them 100° or more
Nights at or below 32°53 · and 1 days that stay below freezing
Climate typeWarm-summer Mediterranean · Köppen Csb
1Freeze season · from the first fall freeze, about Oct. 30, to the last in spring, about April 15 (median dates)
2Wettest stretch · November through January: 23.2 of the year’s 54.5 inches
NOVEMBER 14 IN THE RECORD

On November 14 Waterloo normally reaches 53° and falls to 38°. The record high is 74°, in 1999; the record low 17°, in 1978. The most rain on this date, 1.95 in, fell in 2014.

Normals 1991–2020 and records since 1969 at Foster Dam, 9 miles southeast, 140 ft higher. NOAA, through RCC-ACIS.
3

Where the rain goes

≈ 240 mito the Pacific OceanVail Creek → South Santiam → Santiam → Willamette → Columbia

A raindrop that lands in Waterloo reaches the Pacific Ocean by way of Vail Creek, the South Santiam, the Santiam, the Willamette and the Columbia: about 240 river miles.

Lake on the way: Willamette Falls Hydroelectric Power Reservoir.

100 miles of the trip are on the Columbia.