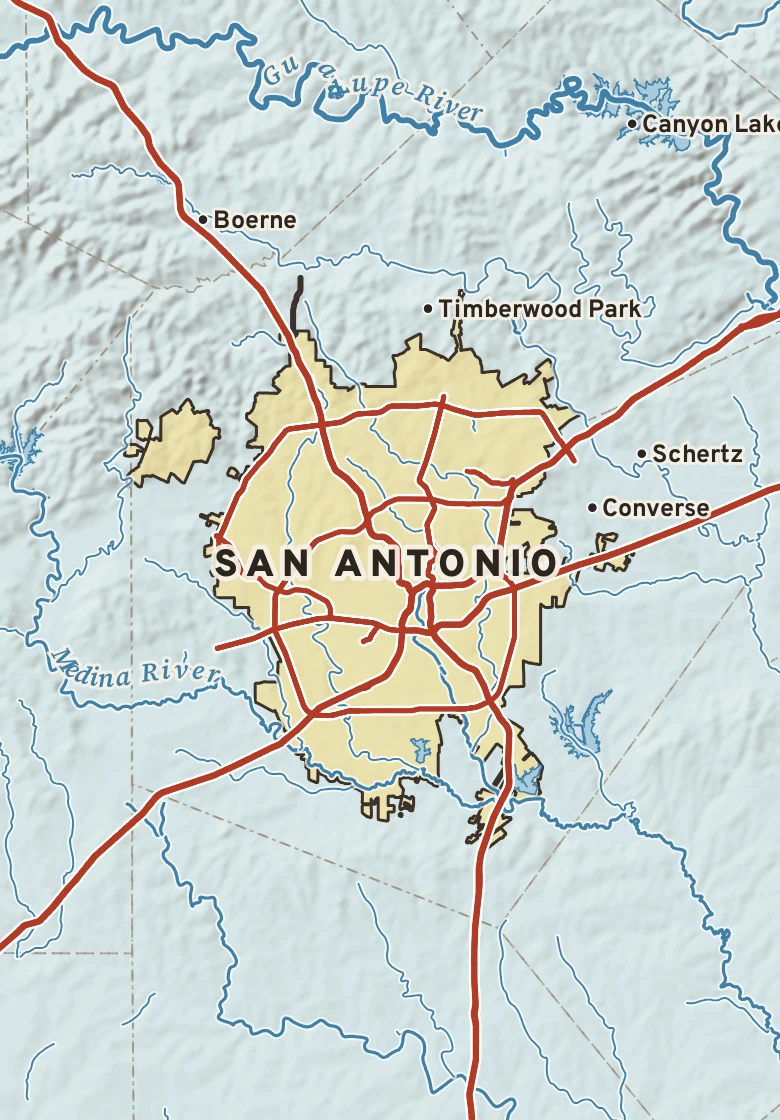
The San Antonio plate. Relief from Copernicus GLO-30; rivers and lakes from USGS NHD; watersheds from the USGS Watershed Boundary Dataset; roads and city limits from Census TIGER 2024.
23° on Nov. 14, 2018, the coldest reading for this week of the year since 1885. Next is 26° in 1950.
San Antonio’s center stands about 660 ft above sea level. Within three miles the land runs from 600 ft to 790 ft, a difference of 190 ft: gently rolling country. The highest named summit within 15 miles is Bush Hill, about 1,340 ft, 15 miles north-northwest.
Under the town center the state geologic map shows Terrace deposits (sand), from the Pleistocene to Holocene, less than 2.6 million years old.
The section below crosses 9 rock units mapped at the surface.
Heights every 0.1 mile from the Copernicus GLO-90 surface model; vertical exaggeration about 37×. The colored band under the surface is the rock the state geologic map shows at the surface, not a picture of what lies beneath.
Sand. Age: Pleistocene to Holocene, less than 2.6 million years old. About 9 mi of the line.
Limestone, carbonate. Age: Late Cretaceous, 66 to 72 million years old. About 3 mi of the line.
Marlstone, chalk. Age: Late Cretaceous, 66 to 100 million years old. About 3 mi of the line.
Clay, siltstone-mudstone. Age: Late Cretaceous, 66 to 100 million years old. About 3 mi of the line.
Gravel. Age: Late Pliocene to Pleistocene, less than 3.6 million years old. About 2 mi of the line.
Mudstone. Age: Late Paleocene to Early Eocene, 48 to 59 million years old. About 2 mi of the line.
From the USGS State Geologic Map Compilation (Horton and others, 2017), the states’ geologic maps joined at a common scale. 3 smaller units along the line are not listed.
Heights from Copernicus GLO-90 (a surface model: it includes buildings and tree canopy); summits from USGS GNIS; rivers from USGS NHDPlus HR; rock from the USGS State Geologic Map Compilation.
A raindrop that lands in San Antonio reaches the Gulf of America by way of Alazan Creek, San Pedro Creek, the San Antonio, the Guadalupe and the South Guadalupe: about 250 river miles.
Traced down the USGS NHDPlus V2.1 river network from the Census center point of San Antonio; river miles along the main stem, rounded.
San Antonio has a humid subtropical climate. Summer afternoons average 96° in August; winter nights fall to about 41° in January. About 32 inches of rain fall in a normal year.
On November 14 San Antonio normally reaches 72° and falls to 50°. The record high is 89°, in 1983; the record low 23°, in 2018. The most rain on this date, 1.59 in, fell in 1923.
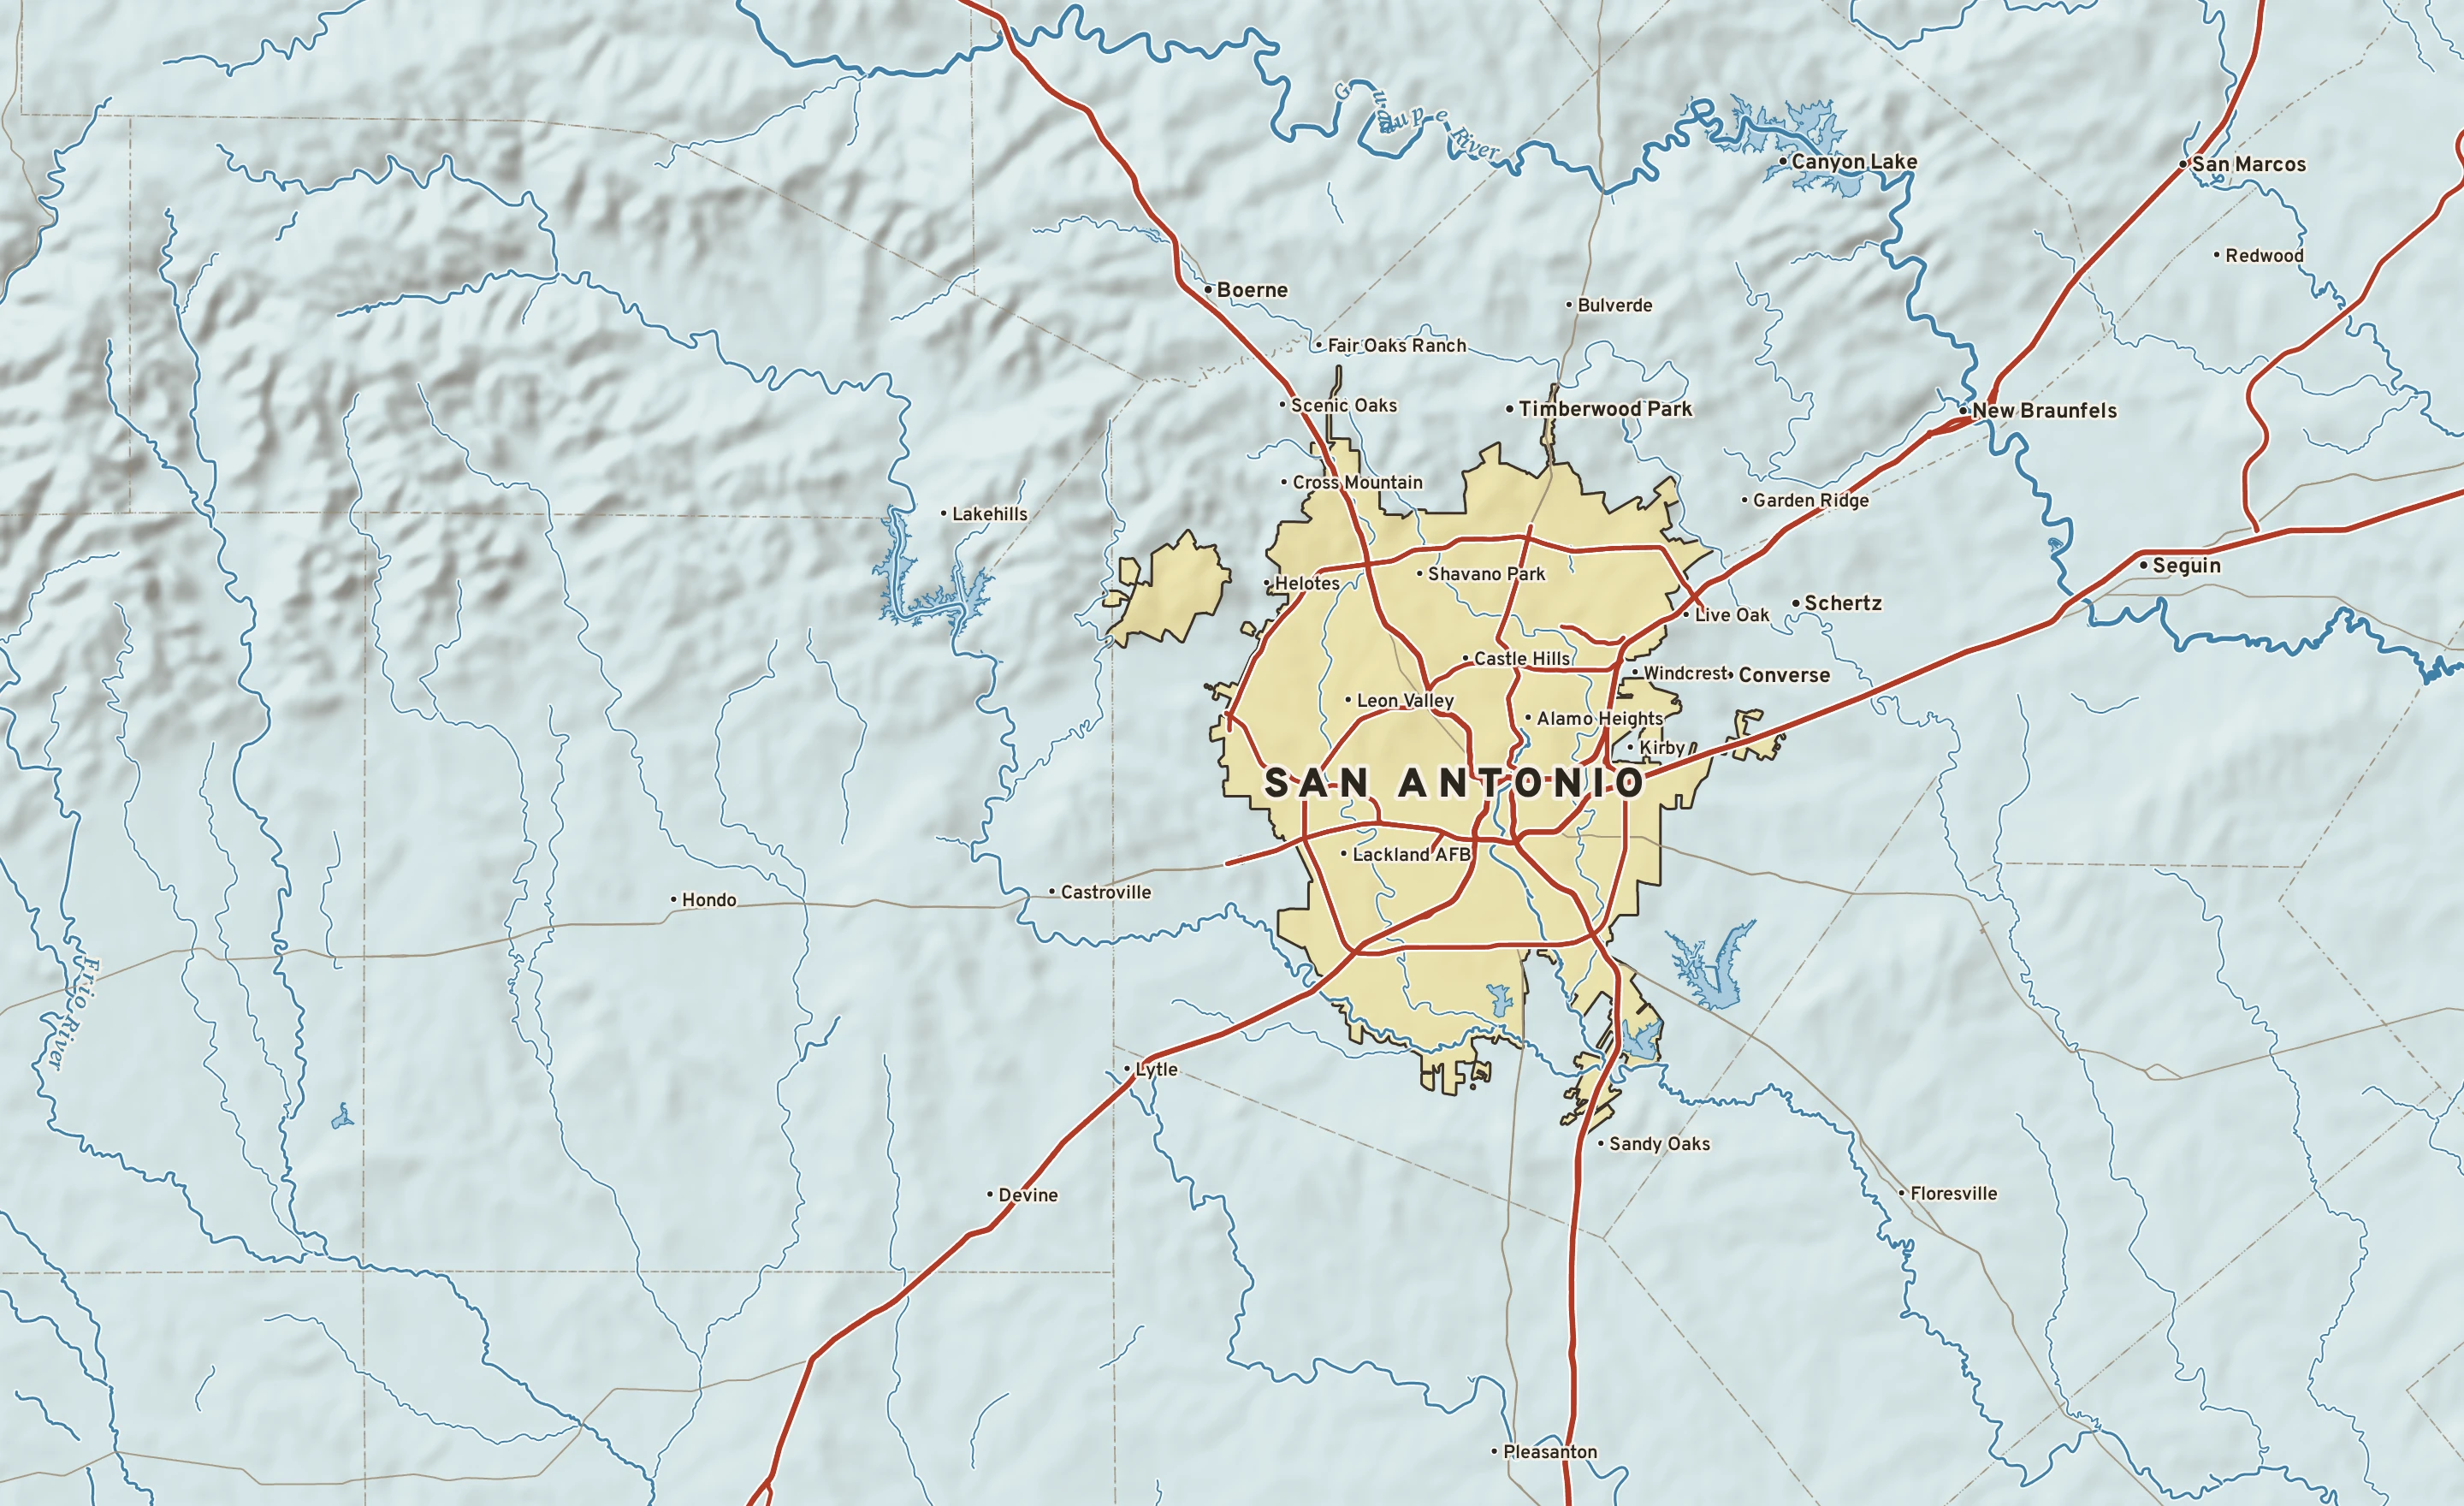
Normals 1991–2020 and records since 1885 from the San Antonio Area threaded record (San Antonio International Airport, 8 miles north, 140 ft higher). NOAA, through RCC-ACIS.