FORECAST CITY
Sign in

Ninety-six hours over Decatur

The last day as it was measured, the next three as they are forecast. Four maps on one timeline, drawn in the same colors, on the same ground, with the same twelve places as the Decatur plate.

Updated 9:33 PM Monday
Redrawn every hour: the latest radar scan, the newest station analysis, the National Blend, and the newest RRFS long run (four a day).
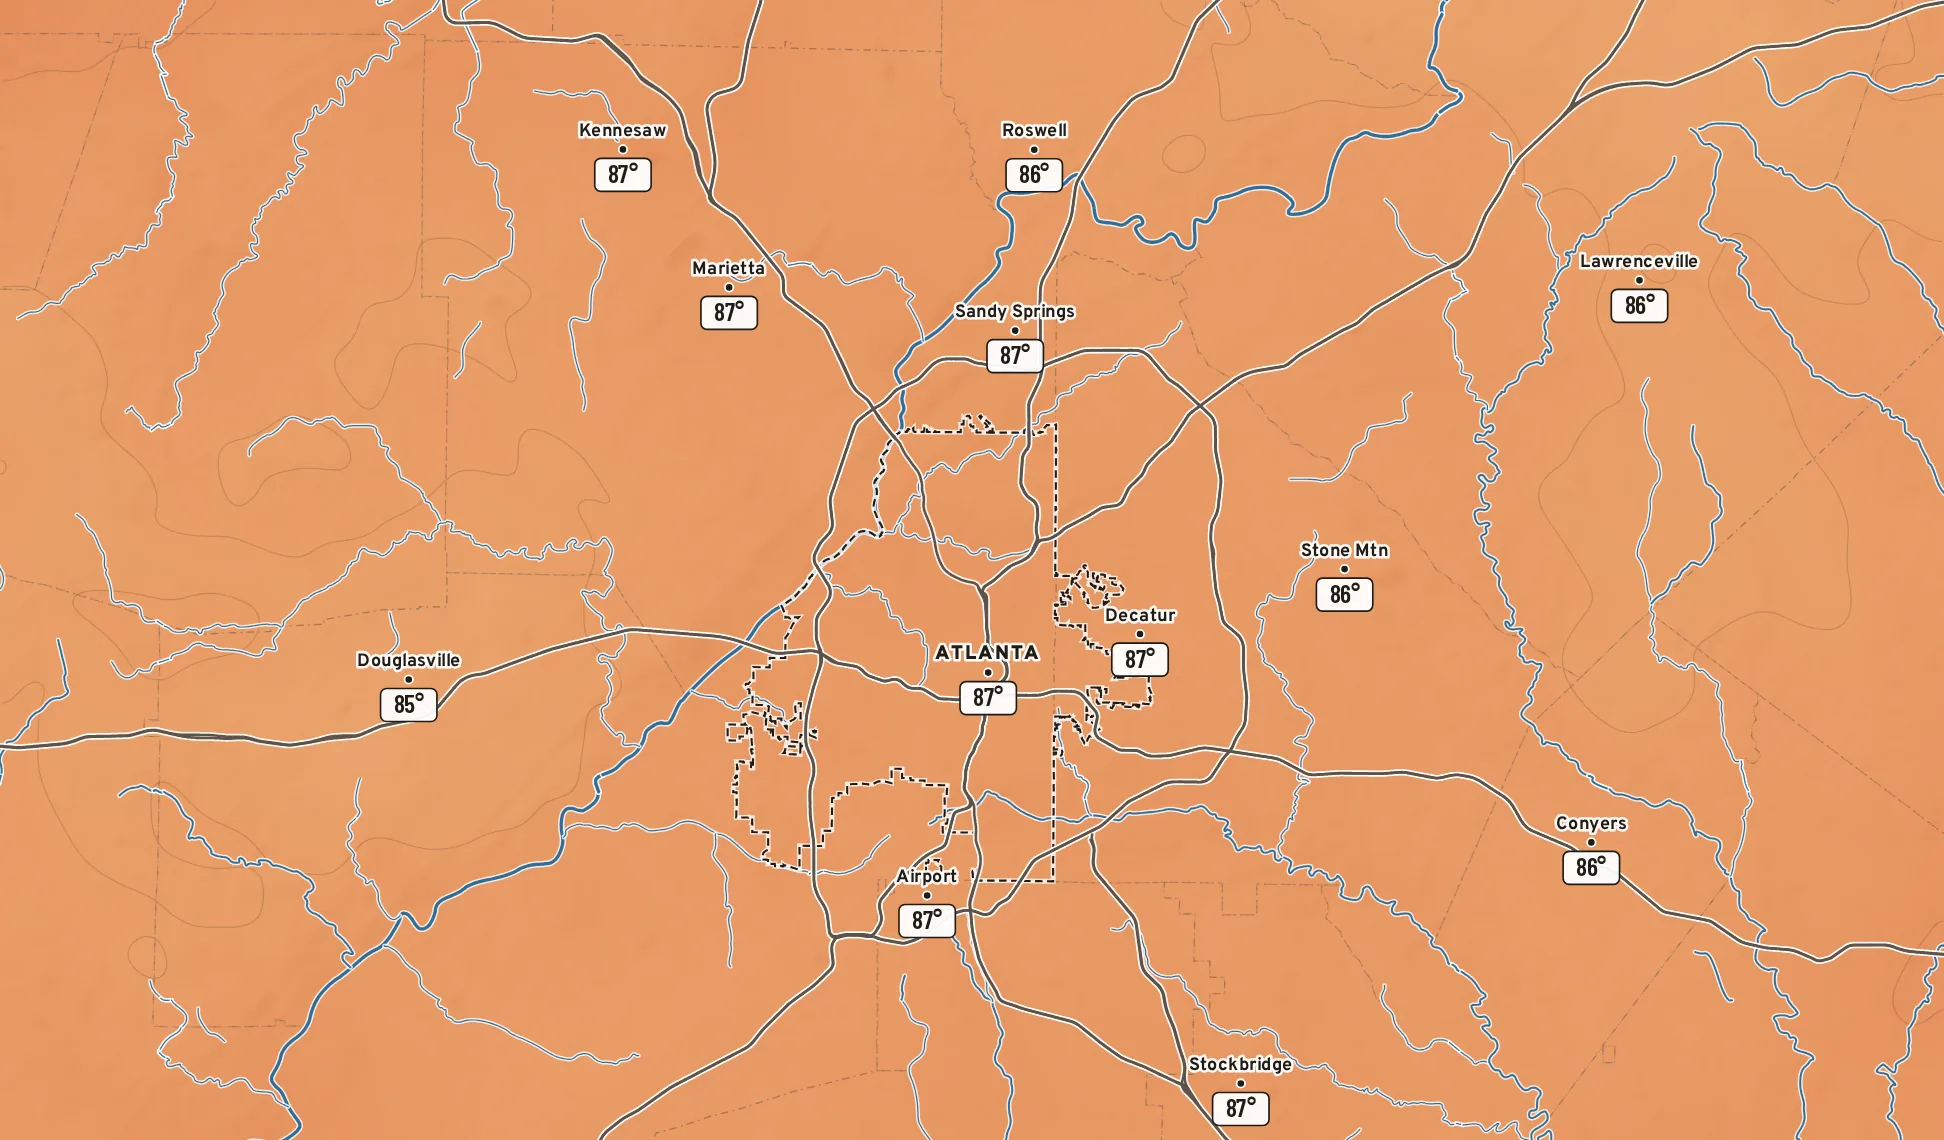
Temperature map of metro Decatur, Wednesday 5 PM (forecast). Downtown should be near 87°, with 85° at Douglasville and 87° at Kennesaw.
FORECAST TEMPERATURE
Wednesday, 5 PMSept. 30, 2026 · Eastern time
Forecast air temperature
DOWNTOWN 87°
National Blend of Models · 7 PM Monday · 46 hours out
Temperature°F
30 40 50 60 70 80 90 100
A line every 2°heavier at 60, 70, 80, 90
5 miles
MON 28WED 30THU 1 NOW · 9 PM
OBSERVED · MRMS RADAR, RTMA & URMA FORECAST · RRFS & NATIONAL BLEND Rain in the metroNight
WEDNESDAY · 5 PM · FORECAST

Mid to upper 80s across the metro

Downtown should be near 87°, with 85° at Douglasville and 87° at Kennesaw.

TEMPERATURE AT THREE PLACES
Downtown 87°
Airport 87°
Atlanta 87°

Three maps worth a look today

Chosen each morning from the day’s maps, with a sentence on why
Forecast temperature for 5 PM Wednesday: Downtown should be near 87°, with 85° at Douglasville and 87° at Kennesaw. TEMPERATURE · FORECAST
WEDNESDAY · 5 PM

Mid to upper 80s across the metro

Downtown should be near 87°, with 85° at Douglasville and 87° at Kennesaw.

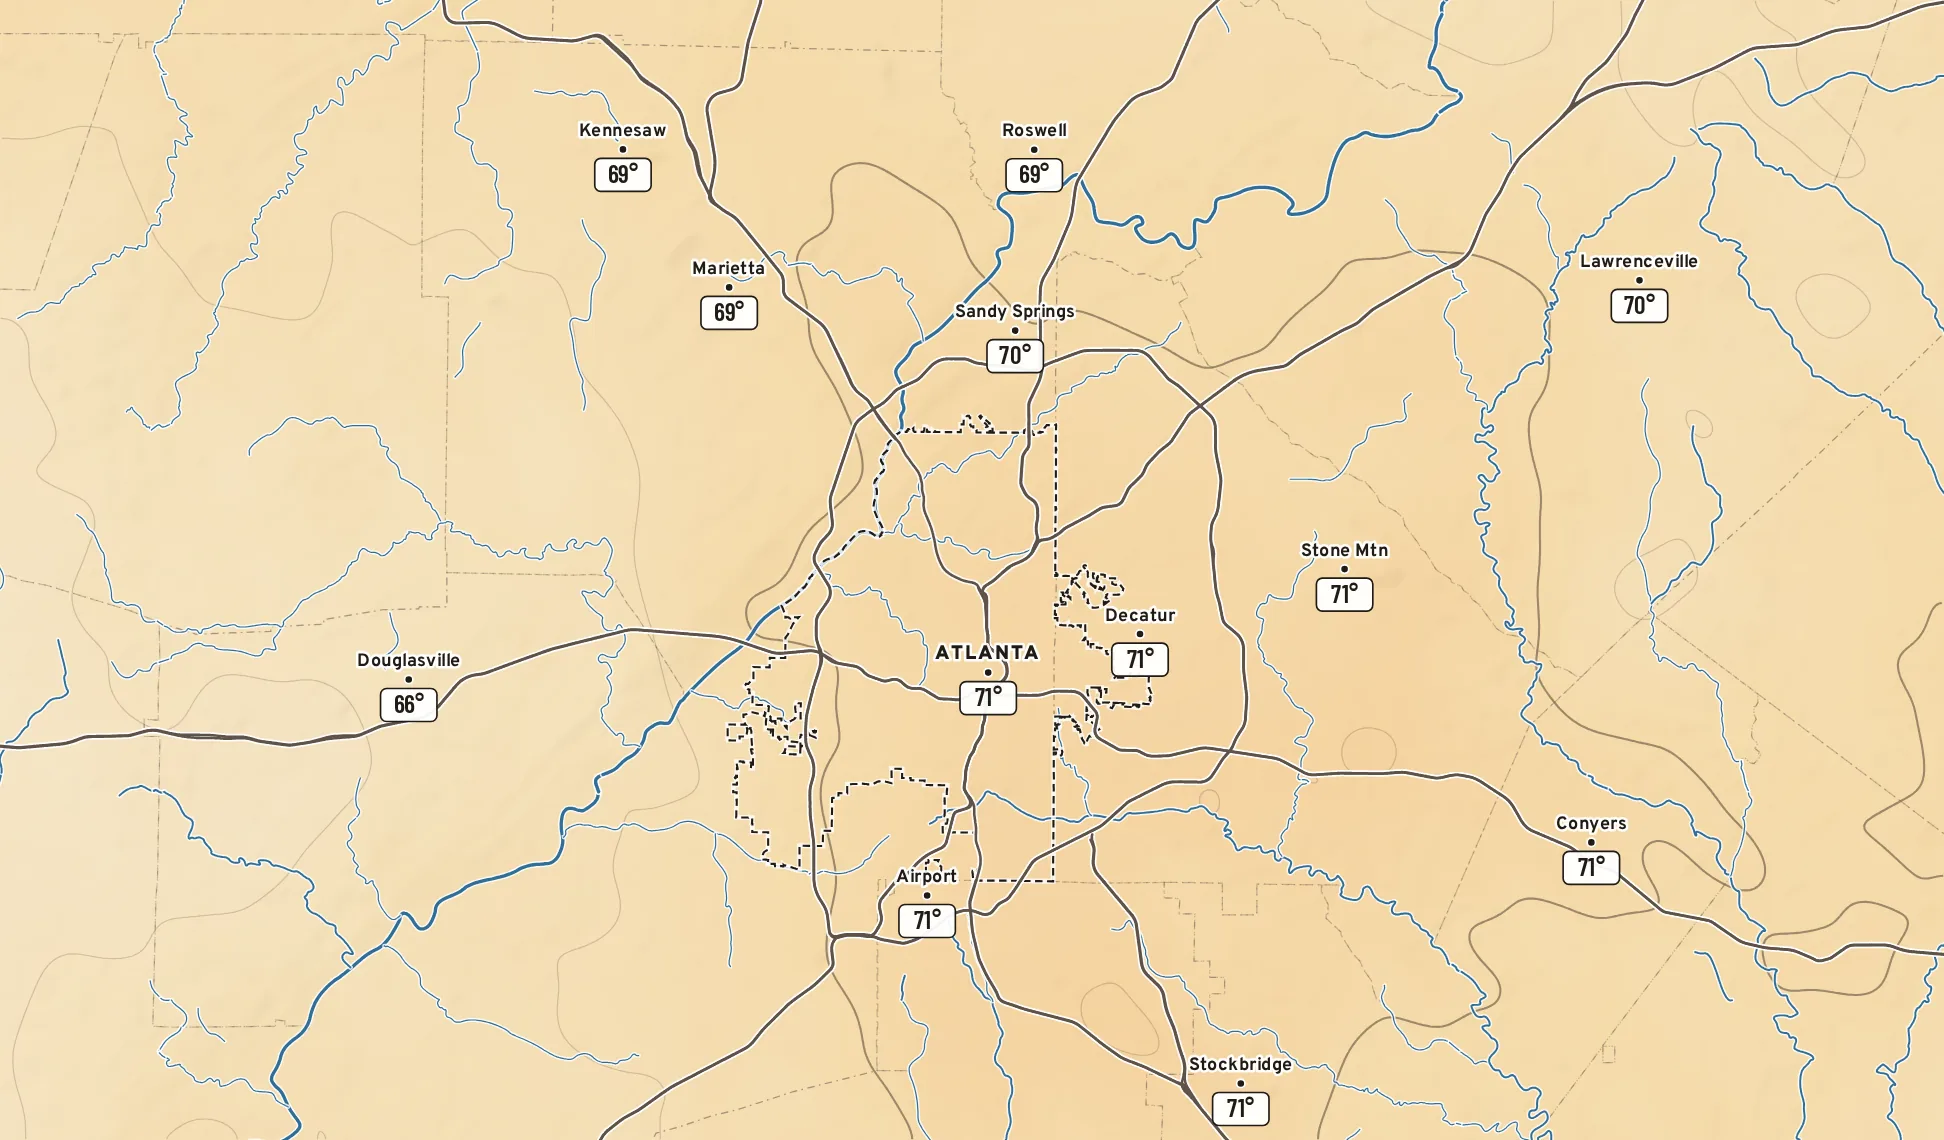
Analyzed temperature now: Downtown was 71°; the metro ran from 66° at Douglasville to 71° at Stockbridge. TEMPERATURE · MEASURED
RIGHT NOW

Mid 60s to low 70s across the metro

Downtown was 71°; the metro ran from 66° at Douglasville to 71° at Stockbridge.

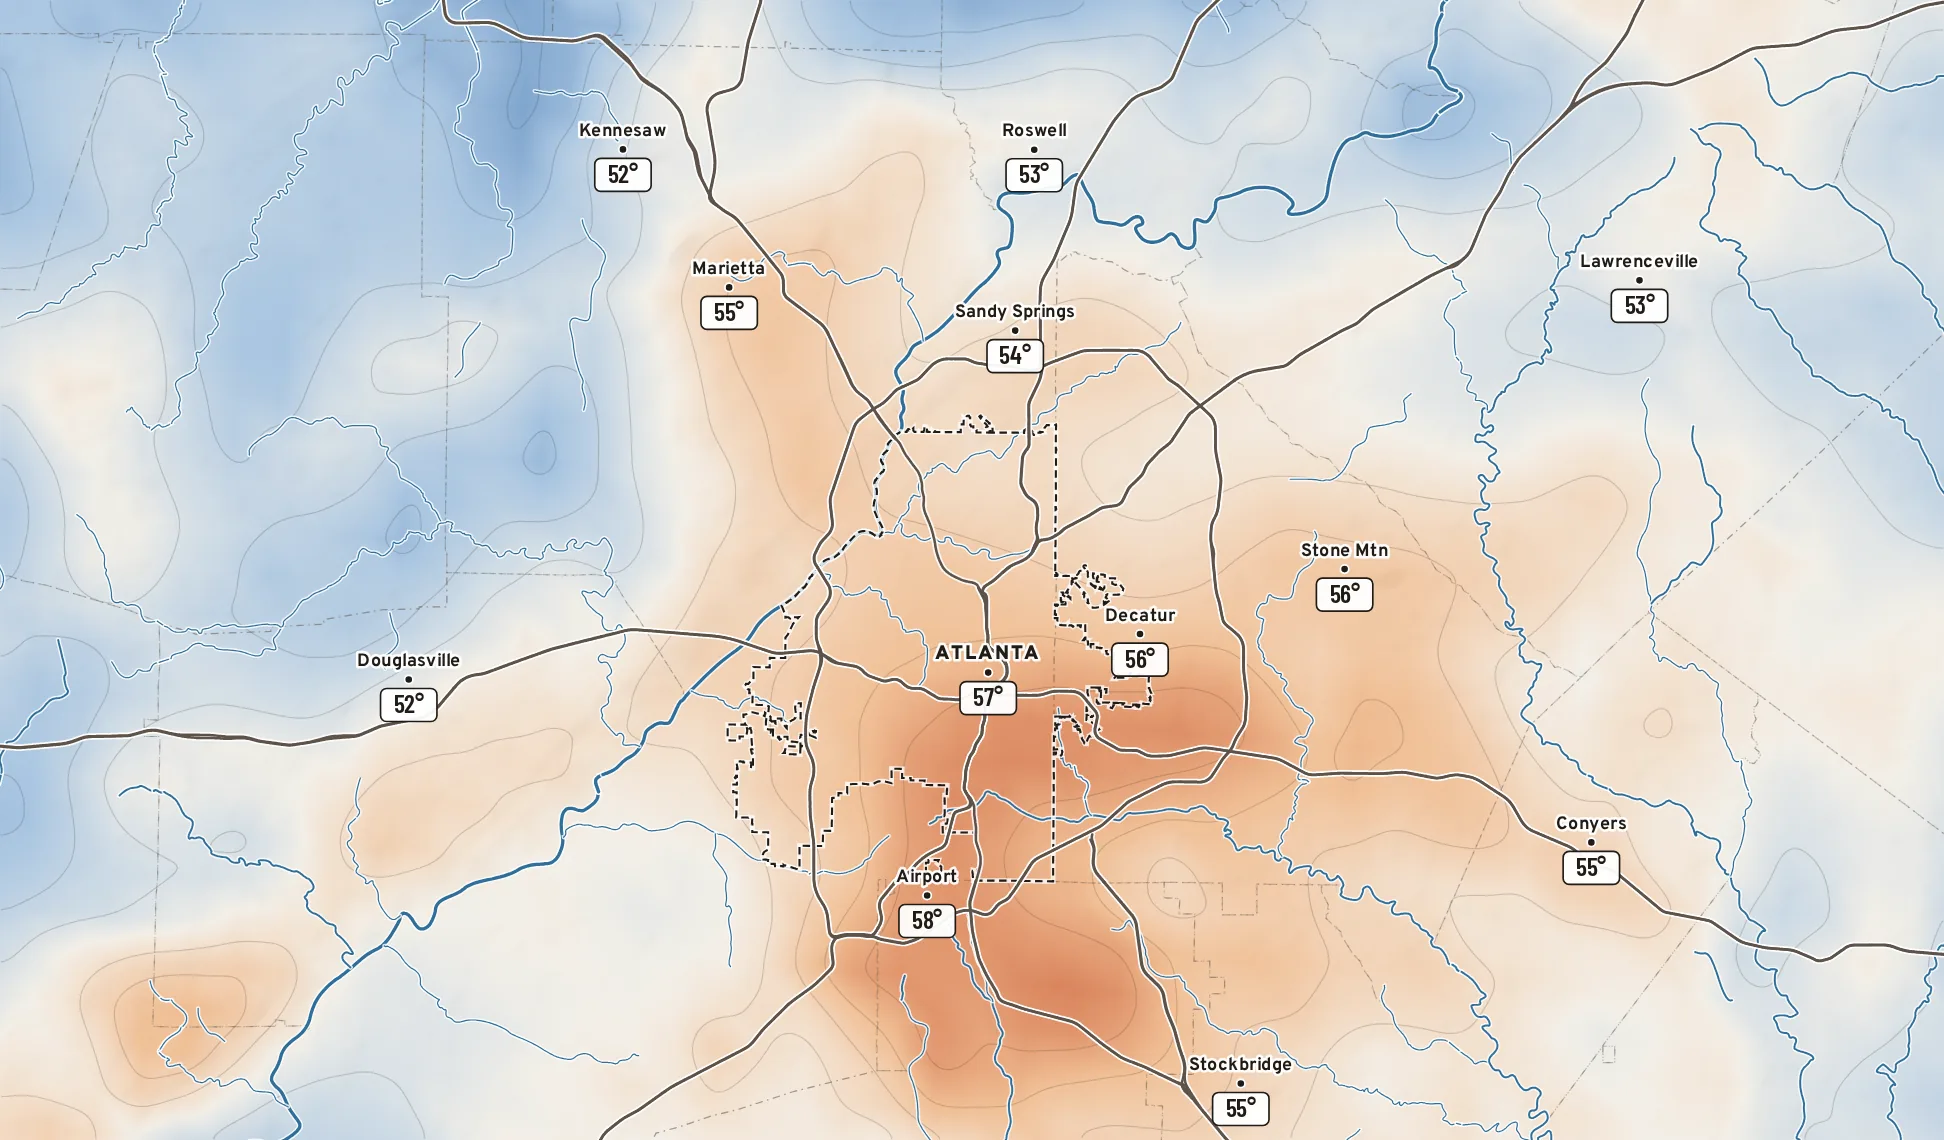
Temperature difference at 5 AM Monday: warmer over downtown, cooler in the suburbs and creek valleys. WARMER OR COOLER · MEASURED
MONDAY · 5 AM

The city kept its heat overnight

At 5 AM downtown was 57°, about 3° warmer than the middle of the metro; the coolest places reached 52°. Pavement and brick give the day’s heat back all night.

How these maps are made

MEASURED

Radar and rain totals come from MRMS, NOAA’s mosaic of every radar in the country, checked against rain gauges. Temperature and wind come from the RTMA, updated every 15 minutes, and then from the URMA, which arrives about six hours later with more station reports folded in.

FORECAST

Temperature and rain come from the National Blend of Models, the guidance underneath the National Weather Service’s own forecast grids. Radar and wind gusts come from the RRFS, NOAA’s new 3 km model, which runs out 84 hours four times a day and becomes operational Oct. 14.

DRAWN ONE WAY

Every map uses the Forecast City theme: the atlas ground, the same twelve places, and color scales built so equal steps in weather look like equal steps in color.

See the map theme →
GOING DEEPER

Soundings, upper-air charts, model-by-model comparisons and every field in the Blend live on Forecast Eagle, the network’s site for weather enthusiasts.

Decatur on Forecast Eagle →

Redrawn every hour from NOAA data: MRMS radar and rain, RTMA and URMA analyses, the National Blend of Models (7 PM Monday run) and the RRFS (2 PM Monday run). Headlines and stories are written by rules from the maps themselves. Relief from 3-arc-second terrain; roads from Census TIGER; rivers from Natural Earth.